Bitcoin Erases August Gains: Will $60K Hold as ETF Outflows Grow?


Key points
BTC trades near $64,832 in a 24h range of $63,738.9 to $66,093.2.
Spot ETFs lost $1.065 billion last week, the third straight outflow week.
The largest liquidation cluster sits at $60K-$63K.
Bulls need $68K-$69K back to change the trend.
Bitcoin has erased its full August rally and trades near $64,832. BTC is up 0.14% in 24 hours, with a market cap of $1.31 trillion.
In August, the coin rose 23.5%, from $62,818 to $77,593 in seven days. Falling bond yields, a weaker dollar, short covering, and $1.92 billion in weekly ETF inflows drove it. That support has faded.
ETF Outflows Keep Weighing on Demand
Spot Bitcoin ETFs saw net outflows of $1.065 billion during Nov. 9 to 13, per SoSoValue. It is the third week in a row.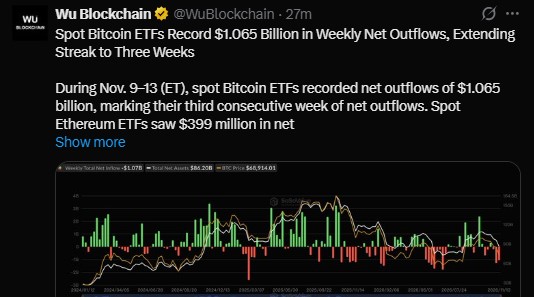
Wu Blockchain's chart shows weekly net flow of -$1.07 billion, total net assets near $84.20 billion, and a BTC price marker at $68,914.01. CoinGlass lists a $185.4 million outflow on Nov. 13.
Whales Sell While Strategy Hints at Buying
Glassnode says whales deposit about $55 million of BTC a day more than they withdraw. A turn back to net withdrawals would be the first sign they are done.
Michael Saylor posted that the dip "could use a little orange." Strategy holds 850,364 BTC worth $55.70 billion, bought at an average of $76,446. His tracker shows a loss near 12.58%.
Futures Data Shows a Cautious Market
Open interest is $41.86 billion, down 5.06%. Funding is slightly negative at -0.0005%, and Binance perp basis is -0.067%.
Spot volume fell 45.08% to $5.54 billion. Futures volume dropped 51.06% to $54.62 billion, about 9.9 times spot.
Liquidations total $106.23 million in 24 hours. Shorts lost $68.46 million, and longs lost $37.77 million.
The short windows tell a different story. The last hour saw $524.09K, with $449.21K from longs. Four hours show $7.22 million, and 12 hours show $24.40 million, with shorts at $14.76 million.
24h ratio | Binance | OKX | Bybit | Gate | Hyperliquid |
Taker buy/sell | 1.0074 | 1.0259 | 1.0231 | 0.9709 | 1.0116 |
Accounts long/short | 2.8775 | 2.6900 | 2.6600 | 1.6818 | 1.8794 |
Top trader positions | 1.7317 | 1.1961 | 0.9798 | 0.9377 | 0.7965 |
Buying edges out selling on most exchanges, and regular accounts lean long. Big traders on Bybit, Gate, and Hyperliquid lean short. Gate is the only taker ratio under 1.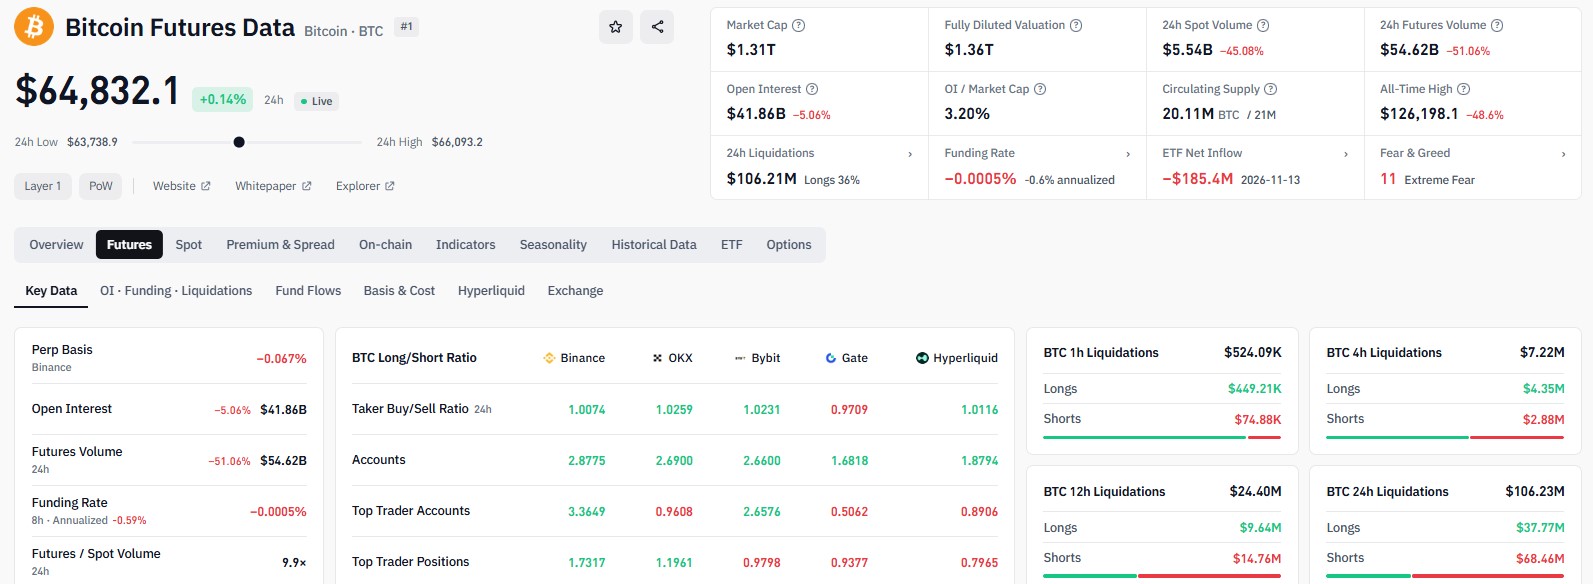
The Fear & Greed Index reads 10 on alternative.me. It was 29 last week and 55 a month ago.
Brandt Asks If a Head and Shoulders Top Is Real
Peter Brandt asked if this is a legit Head & Shoulders top. If yes, he could argue the $126,198.1 all-time high is in for good. BTC is 48.6% below it.
He posed it as a question, not a call. The pattern needs a neckline break to count.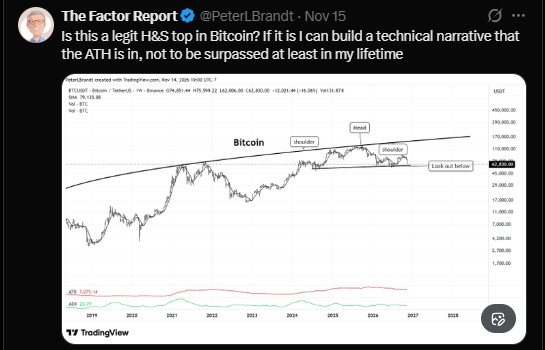
BTC Price Forecast: Scenarios and Key Levels
Glassnode says price briefly touched the largest liquidation cluster, between $60K and $63K. It also flagged a rally on thin volume and fading demand.
Scenario | Trigger | Levels to watch |
Bullish | Holds $60K, reclaims 68K-69K | 68K-69K, then the $77,593 August high |
Neutral | Stays between $60K and $68K | Choppy, low-volume trade |
Bearish | Breaks below $60K | 57.7K-58K, 55K-56K, then $50K |
The 57.7K-58K zone is the 2026 low. A break there could set a new yearly low.
ETF outflows need to slow, bigger buyers need to return, and macro pressure needs to ease. None of that is clear yet.
Bitcoin could chop for a while or retest the cluster below. The data says caution, nothing more.
Disclaimer
This article is for information only and is not financial advice. Cryptocurrency prices are volatile, and you can lose money. Do your own research and speak with a licensed financial advisor before you trade or invest.