Bitcoin SV Price Prediction: BSV Surges 15%, Eyes $32


Bitcoin SV has finally broken out of its months-long consolidation, with BSV surging more than 15% in 24 hours and testing the $22.41 resistance zone.
The bigger question now is whether this breakout can push toward $25.92, or whether the overbought RSI triggers another pullback first.
With momentum stretched but structure improving, the Bitcoin SV price prediction picture has turned notably more constructive.
BSV Price Today: Rally Extends Across Every Timeframe
Bitcoin SV is trading near $22.14, up 15.40% over the past 24 hours, according to Coinglass data.
The move is part of a broader run that has taken BSV up 39.09% over the past week, 30.81% over 30 days, and a sharp 101.96% over 90 days.
Bitcoin SV market cap sits at roughly $455.93 million, with BSV circulating supply at 20.08 million tokens against an equal total supply and 24-hour futures volume of $97.39 million against spot volume of $45.92 million, per Coinglass exchange data.
Year-to-date the token is up 28.61%, though it remains down 8.57% over the past year and steep 74.79% from its all-time high, a reminder of how deep the prior bear cycle ran before this recovery.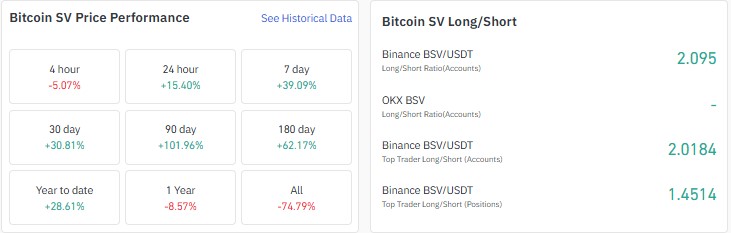
Traders remain heavily net long on BSV. Binance's BSV/USDT long-short account ratio reads 2.095, and its top-trader accounts and positions ratios sit at 2.0184 and 1.4514, all skewed firmly toward longs.
Bitcoin SV Long-Short Positioning and Liquidations
Binance leads trading activity at $31.77 million, followed by Gate at $22.83 million and LBank at $16.76 million.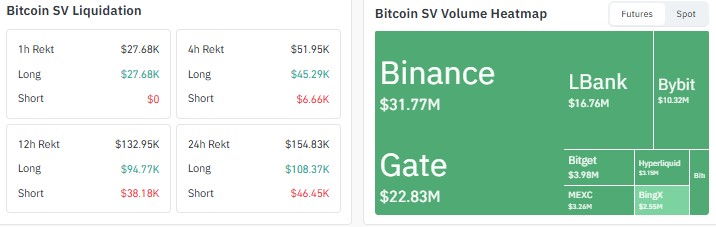
Liquidations tell a more mixed story, though. Over the past 24 hours, $154.83K was wiped out, and longs took the bigger hit at $108.37K against $46.45K in shorts, a pattern that repeats across the 1h, 4h, and 12h windows too.
That combination of long-heavy positioning with long-heavy liquidations points to a volatile, leveraged tape, where traders are net bullish but getting shaken out on the swings rather than a clean one-directional squeeze.
Bitcoin SV Open Interest Approaches Prior Highs
Open interest in BSV derivatives has climbed to $57.67 million, with Coinglass charting it near $54.65 million as price touched $21.10 earlier in the session.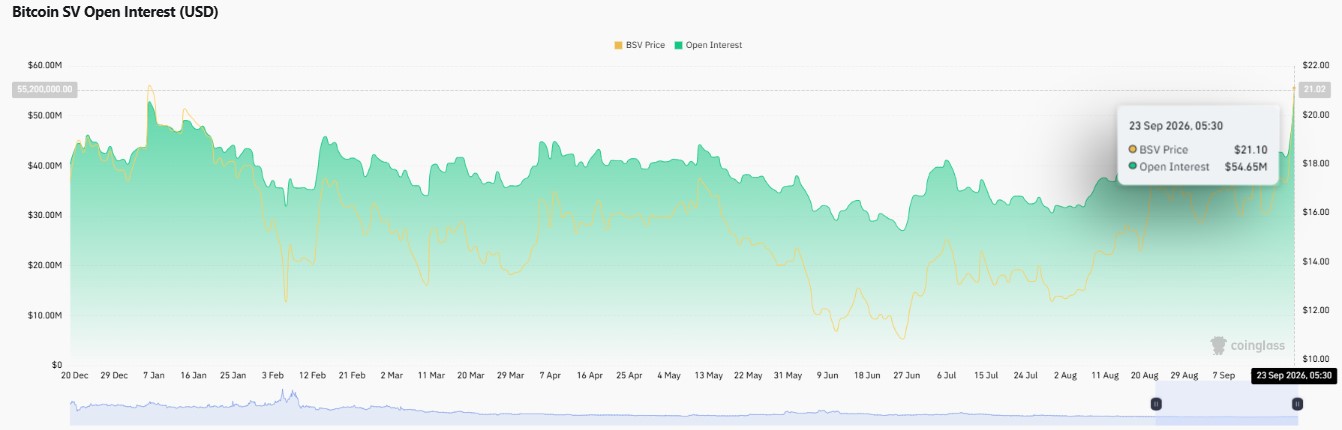
That puts open interest within reach of its year-to-date peak of around $55.2 million, set back in early January.
Rising open interest alongside a rising price generally signals fresh money entering rather than just short covering, which is a healthier setup for the move to have follow-through.
BSV Network Activity Spikes on WhatsOnChain
On-chain activity has picked up sharply alongside the price move. WhatsOnChain data shows the network's daily transaction count climbing from just over 12,000 to past 275,000 within hours on September 22 and continuing to build from there, while the estimated hashrate stands at 225.899 PH/s and mining difficulty at 30.193 x 10^9.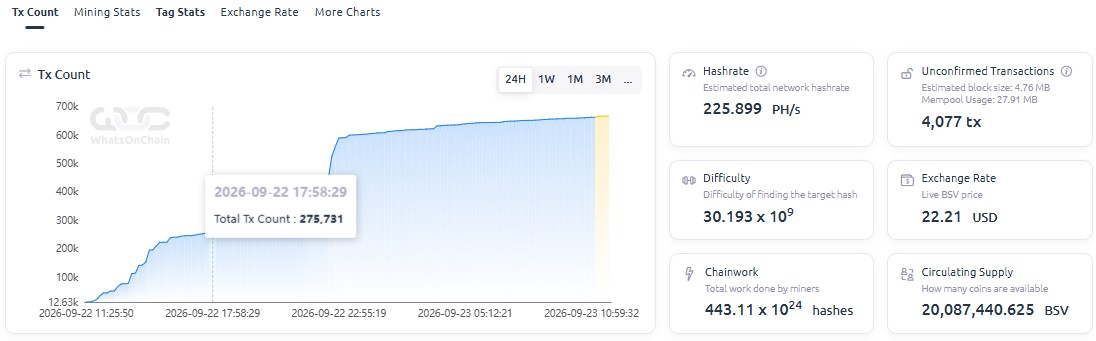
That kind of jump in on-chain throughput across the Bitcoin SV blockchain alongside a price breakout suggests real usage and attention returning to the network, not just exchange-driven speculation.
Bitcoin SV Daily Chart: Triangle Breakout and a Resistance Test
This BSV technical analysis starts with the daily chart on TradingView, which shows BSV breaking decisively out of a symmetrical triangle that had capped price for months, clearing the 17.668 resistance and extending toward the next supply zone at 22.415.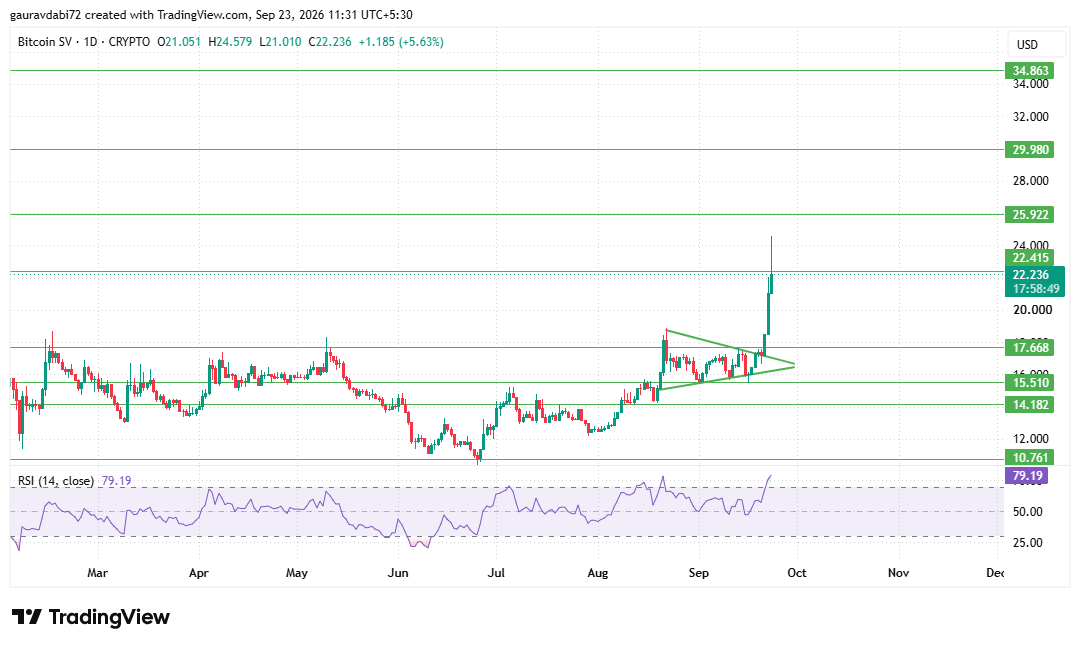
The candle actually pushed as high as 24.579 intraday before sellers stepped back in, pulling the price back to close around 22.236, just under that 22.415 level.
That kind of move, a clean break above resistance followed by a fade back toward it, usually points to profit booking after a fast, overextended rally rather than an outright rejection of the breakout.
The 14-period RSI on the daily is sitting at 79.19, deep in overbought territory, which supports the idea that some of this pullback is simply traders locking in gains after a 100%-plus three-month run.
As long as BSV holds above the 17.668 zone, the breakout structure stays intact, but a clean daily close above 22.415 is still needed to confirm the next leg higher rather than another round of chop under resistance.
Where Could Bitcoin SV Price Go After the Triangle Breakout?
For this Bitcoin SV price prediction 2026 outlook, if BSV manages to close above 22.415 and hold it, the BSV resistance levels to watch next are 25.922, then 29.980 and 34.863, each of which could act as a fresh profit-taking zone given how far the price has already run.
On the downside, a slip back below 22.415 without much damage would still keep the broader breakout intact as long as 17.668 holds, while a break of that level would push focus toward the lower BSV support levels at 15.510 and 14.182.
Given the overbought daily RSI, some further consolidation or a retest of the breakout zone would not be unusual before the next leg, if the larger uptrend stays intact.
Key Risks for BSV Bulls
The most immediate risk is the deeply overbought daily RSI, which raises the odds of a deeper pullback if buyers do not show up quickly at current levels.
Liquidation data already shows leveraged longs getting hit harder than shorts even during an up move, a sign that the current rally is choppy and can shake out over-leveraged positions fast.
BSV's steep 74.79% drawdown from its all-time high is also a reminder that the token has a history of sharp reversals after strong short-term rallies, so chasing strength without a level to invalidate the trade carries real risk.
Analyst Desk View
As per the CoinGabbar analyst desk, the triangle breakout combined with climbing open interest and a sharp pickup in on-chain transaction activity supports a constructive near-term Bitcoin SV price prediction.
But the pullback from the 24.579 intraday high looks more like profit booking after an overextended move than a failed breakout.
A confirmed daily close above 22.415 would strengthen the bullish case, while losing the 17.668 zone would be the clearer signal that momentum has faded.
Conclusion
Bitcoin SV has staged one of its strongest breakouts of the year, clearing a months-long triangle pattern, pulling open interest back toward its yearly highs and drawing a visible pickup in network activity.
The pullback from the recent high near $24.58 looks like profit booking rather than rejection, and the Bitcoin SV price prediction stays constructive above 17.668, though the overbought RSI means near-term chop should be expected before any confirmed move past 22.415.
Disclaimer: This article is for informational purposes only and does not constitute financial advice. Cryptocurrency markets are highly volatile, and readers should conduct their own research before making any investment decisions.


















