Bitcoin Tests $76,400 Support as Binance Hack Fears Hit Traders Hard


Bitcoin is heading for a fourth straight weekly loss, and the pressure is building near a key support zone.
BTC traded near $78,350 on Oct. 30, down about 2.2% on the day. The daily low touched $76,320 before buyers stepped in. Market cap sits near $1.57 trillion.
Binance Hack Fears Spark a Fast Sell-Off
Billions in unusual transfers from Binance-labeled wallets set off hack fears around 5:52 p.m. ET. Binance said it is investigating a possible security issue and that user funds are safe.
Tether and Circle have frozen more than $2.3 billion in related stablecoins. Another 200 million USDT reportedly moved at 5:44 p.m. ET.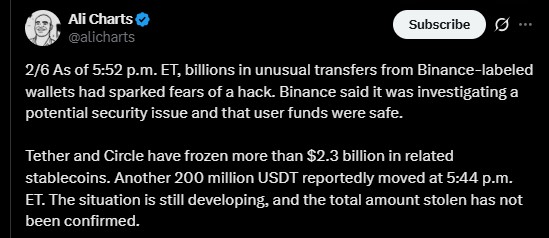
The news came right after the FOMC meeting. Markets mostly expect the Fed to hold rates, though a possible December hike is still in focus.
Earlier this week, BTC rose 1.36% from about $80,628 to $81,721, then reversed. In past FOMC meetings, the first-hour move was often under 1%. The real direction usually shows over the next 24 hours.
Price Slips Out of Its Channel and Lands on the 200-Day EMA
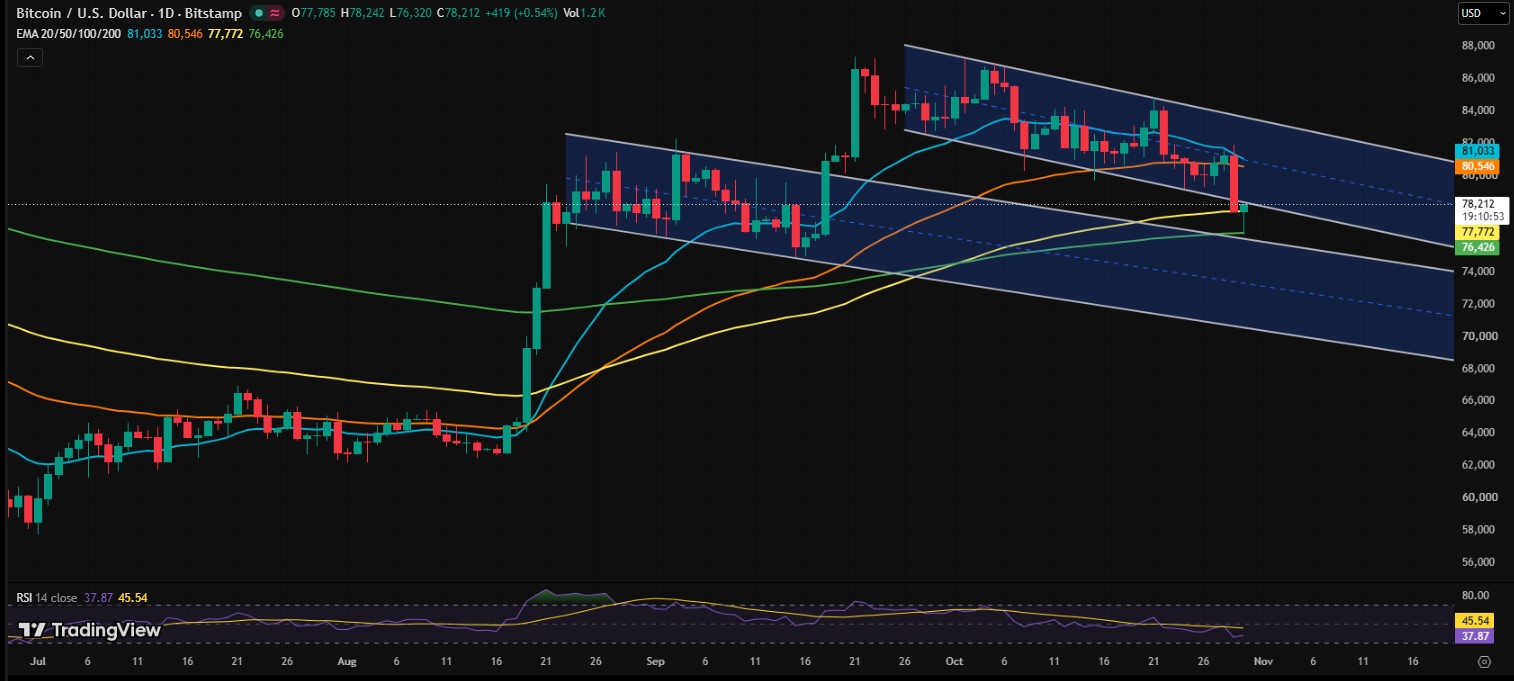
BTC broke below its descending channel and is now testing the 200-day EMA. The 100-day EMA sits just above it.
The RSI reads 37.87. That is weak, but not yet oversold.
Level | Price | Role |
20-day EMA | $81,033 | Resistance |
50-day EMA | $80,546 | Resistance |
100-day EMA | $77,772 | Near-term pivot |
200-day EMA | $76,426 | Key support |
Daily low | $76,320 | Recent bottom |
Whales Trim Holdings as US Demand Cools
As per CryptoQuant, Whales realized about $156 million in profit recently. That adds to possible selling pressure.
Their holdings also fell by roughly 8,162 BTC in 24 hours. That is worth about $664 million.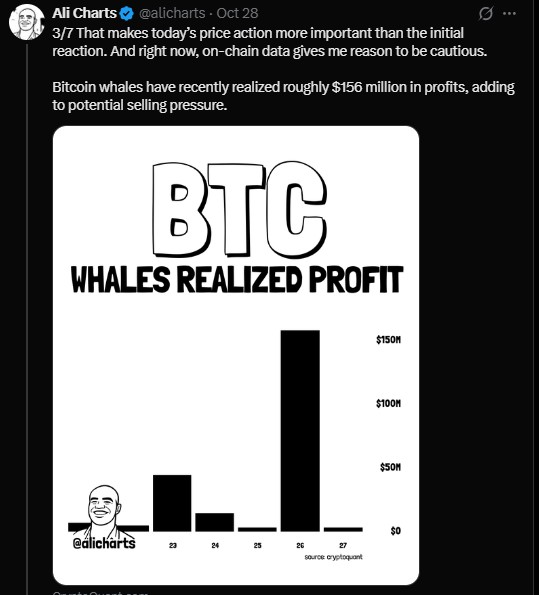
The Coinbase Premium Index slid to around -0.17, one of its lowest readings since September. A negative number means BTC is cheaper on Coinbase than on Binance. It hints at weaker US demand.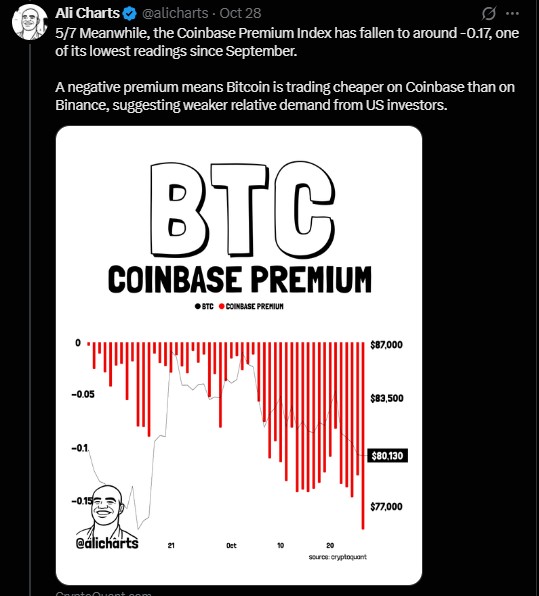
Mood is sour too. The Fear & Greed Index reads 30, or Fear. It was 51 yesterday and 71 a month ago.
Long Traders Take the Hit in Derivatives
Trading activity jumped as prices fell. Longs bore most of the damage.
Metric (24h) | Reading |
Futures volume | $112.63B (+105.46%) |
Open interest | $54.28B (+1.42%) |
Options volume | $9.53B (+128.57%) |
Long/short ratio | 0.9425 |
Total liquidations | $481.84M |
Long liquidations | $405.49M |
Short liquidations | $76.35M |
A ratio below 1 points to slightly more shorts than longs. Still, long traders were squeezed the hardest.
Liquidation data shows short pain starting near $78,669 and long pain below $77,170. Each zone holds about $65.1M in estimated liquidations. A quick move either way could trigger a chain reaction.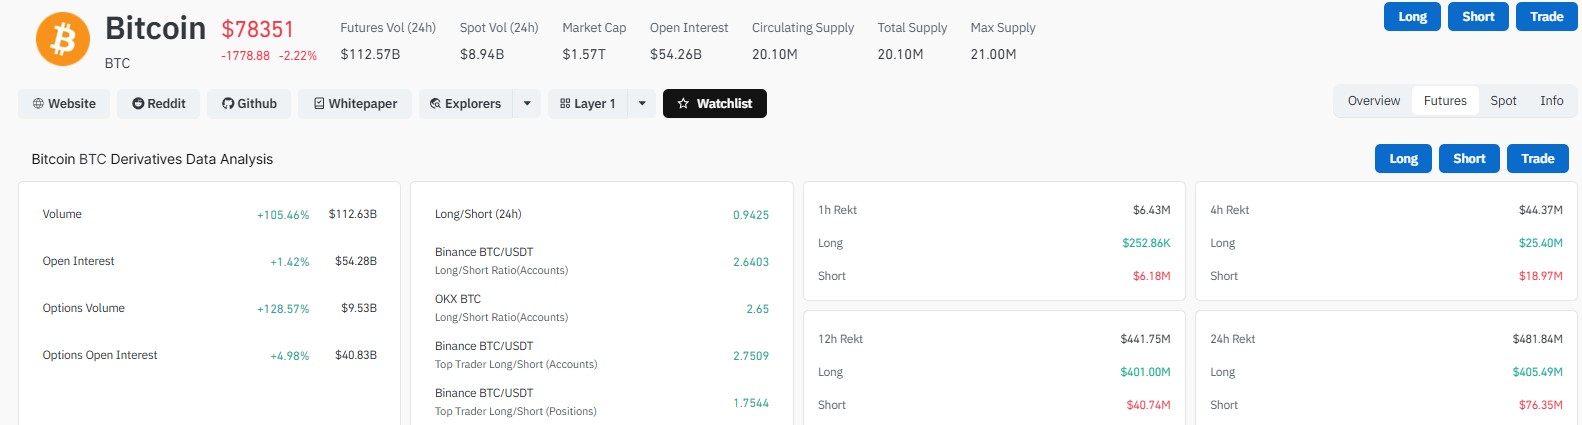
ETF Flows Stay Positive, but Barely
Spot Bitcoin ETFs hold $104.27B in net assets, or 6.58% of market cap. They saw a net inflow of $17.07M on Oct. 29.
Cumulative net inflows stand at $57.62B. Daily trading value was $2.11B.
Fund | Daily Flow |
BlackRock IBIT | +$12.80M |
Fidelity FBTC | +$10.53M |
Bitwise BITB | +$8.76M |
Grayscale GBTC | -$15.35M |
The inflow is small. It shows steady interest, not a rush to buy the dip.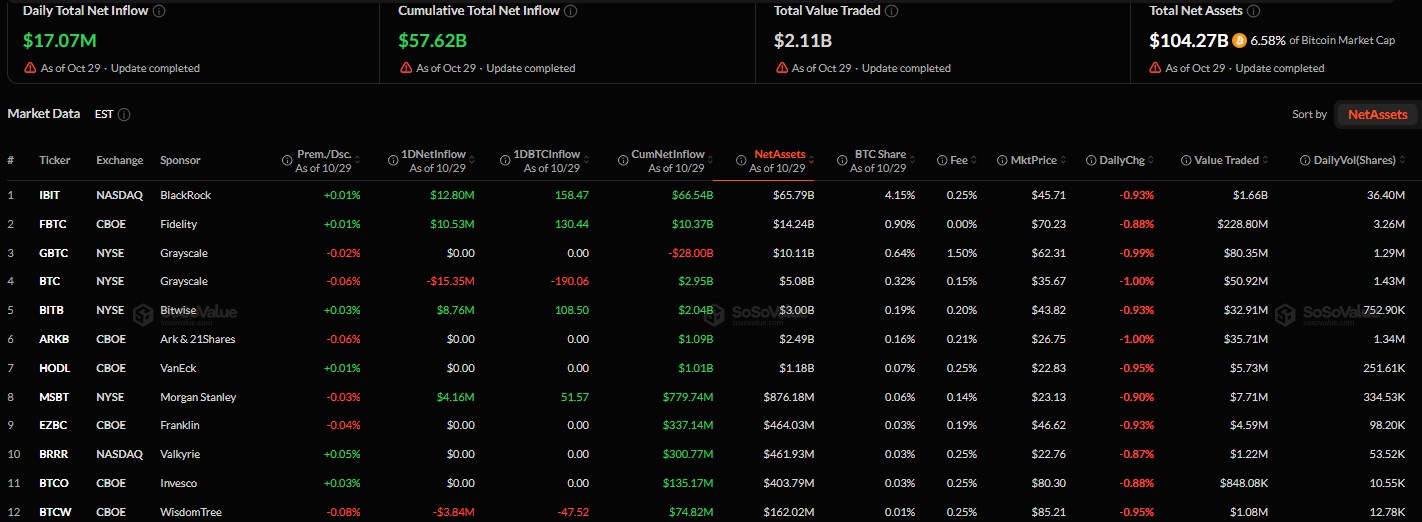
Where BTC Could Go Next
The 200-day EMA at $76.4K is the line to watch. It also lines up with old channel support.
If buyers defend it, a bounce toward $80.5K to $81K is possible. After that, $83K to $84K could come into view. An RSI near oversold levels may help a short-term recovery.
If BTC loses the 200-day EMA and cannot reclaim it, the next zone sits at $74K to $72K. That risk is real, given the news flow.
Scenario | Trigger | Possible Zone |
Bullish | Holds $76.4K | $80.5K to $81K, then $83K to $84K |
Bearish | Loses $76.4K | $74K to $72K |
Volume and open interest are rising. That often means bigger swings are close. Traders may want to wait for a clear move before adding new positions.
Nothing here is certain. Hack news can change fast, and so can the market.
Disclaimer
This article is for information only and is not financial advice. Cryptocurrency is volatile and carries a high risk of loss. Price levels and forecasts are not guaranteed. Always do your own research and speak with a licensed financial advisor before investing.