Bitcoin Whales vs ETF Sellers: Who Controls BTC Near $80K Support?


Bitcoin is trading near $81,658.60 on October 17, 2026. That is down 0.76% in the past 24 hours.
The wider crypto market is soft too. Total market cap fell 0.85% to $2.74 trillion. Ethereum sits near $2,430 and XRP near $1.30.
Traders are now watching ETF flows and the $80,000 support zone for the next clue.
What Is the Bitcoin Price Today?
BTC is slipping, but the move is small. Volume is lower than yesterday, which often means traders are waiting on the sidelines.
Metric | Value |
BTC price | $81,658.60 (-0.76%) |
Market cap | $1.64 trillion |
Futures volume (24h) | $47.89 billion |
Spot volume (24h) | $4.19 billion |
Open interest | $52.81 billion |
Circulating supply | 20.09 million BTC |
Max supply | 21 million BTC |
Why Is Bitcoin Down Today?
A few things are pulling on the price.
Spot Bitcoin ETFs saw net outflows of $82.39 million on October 16, based on SoSoValue data. BlackRock's IBIT led with $71.78 million.
Liquidations added pressure. Traders lost $75.71 million in 24 hours. Longs took $51.95 million of that, while shorts lost $23.76 million.
The last 4 hours saw $210.39K in liquidations, and the last 12 hours saw $2.39 million. The pain is mostly on the long side.
Crypto Rover also posted that U.S. institutions are selling hard. Its chart shows the Coinbase premium at its weakest since the bear market bottom.
That is one analyst's reading. It is worth watching, but it is not proof of a trend.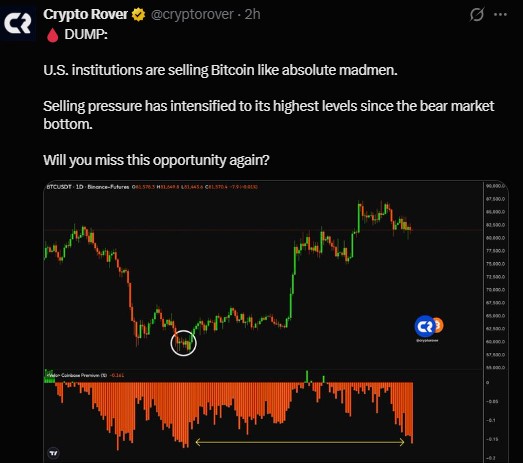
Is the Bitcoin Futures Market Bullish or Bearish?
The signals are mixed. The 24-hour long/short ratio is 0.9826, so the market looks close to balanced.
Open interest rose 0.35%, while futures volume fell 22.41%. People are holding positions but trading less.
Long/Short Ratio | Reading |
All exchanges (24h) | 0.9826 |
Binance BTC/USDT (accounts) | 1.7189 |
OKX BTC (accounts) | 1.81 |
Binance top traders (accounts) | 1.8281 |
Binance top traders (positions) | 1.7409 |
Many accounts on big exchanges lean long. Yet the overall ratio is slightly below 1. That gap shows traders are not fully in agreement.
Options open interest is $38.44 billion, up 1.75%.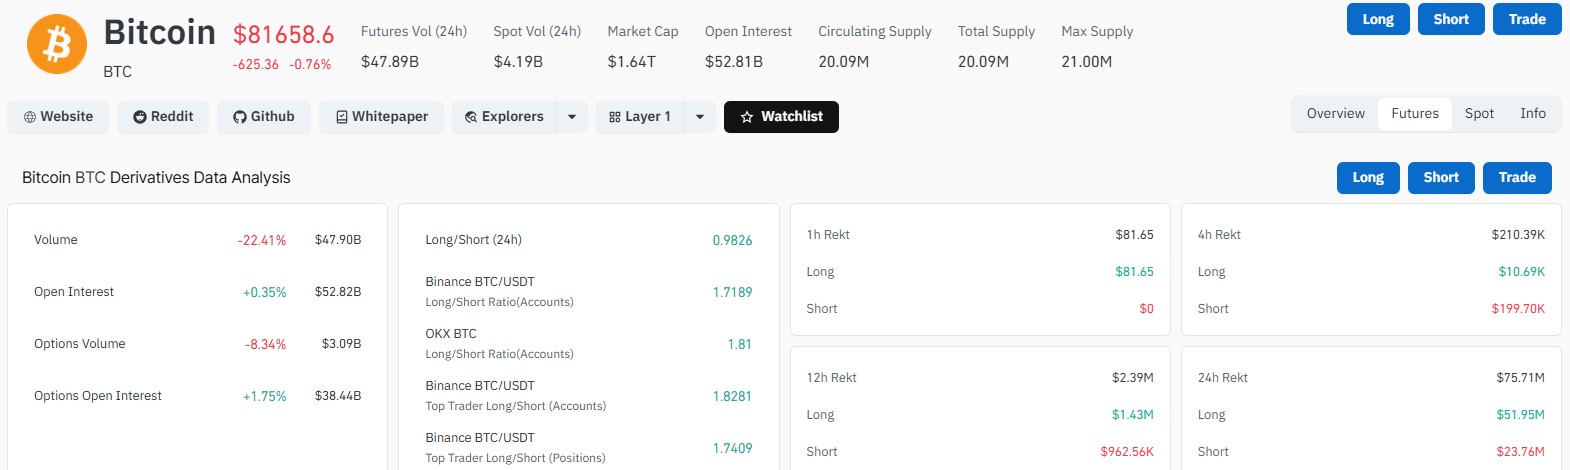
What Are the Key Bitcoin Support and Resistance Levels?
On the 4-hour chart, BTC trades near $81,592 inside a descending channel. It failed to hold momentum near $85,000 to $86,000.
The price now sits at the lower edge of the channel. Support is near $80,000 to $81,000.
RSI is around 44.6. That points to weak momentum, but it is not oversold.
Level | Type | What it means |
$88,000 to $92,000 | Upside target | Possible after a clean channel breakout |
$85,000 to $86,000 | Strong resistance | Top of the channel |
$83,000 to $84,000 | Near resistance | First stop on a bounce |
$80,000 to $81,000 | Key support | Buyers need to defend this zone |
$78,000 | First downside target | If $80,000 breaks |
$76,000 | Next downside target | Deeper pullback |
The chart also shows an earlier breakout from a similar channel. That move ran about 8.5%. A similar breakout now would be worth roughly $7,333, or 8.58%.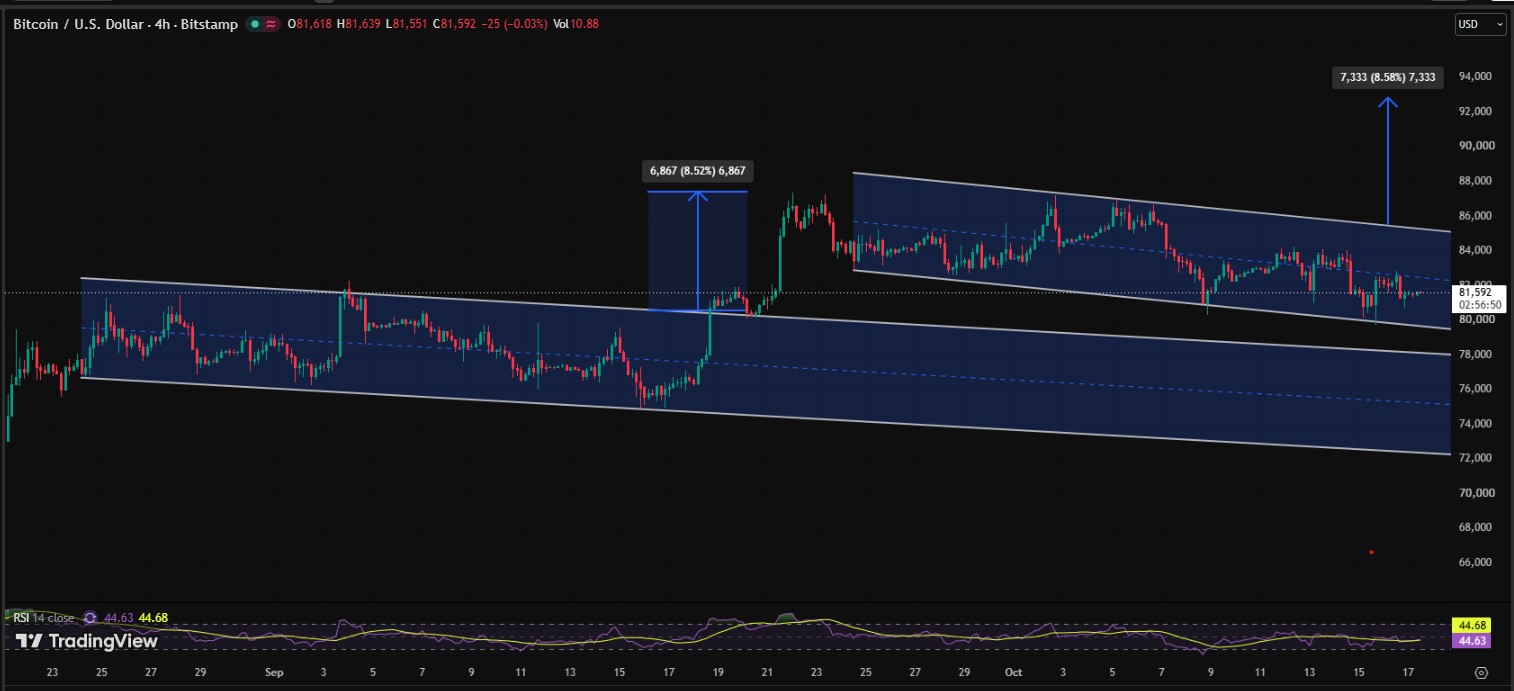
What Are Bitcoin Whales Doing?
CryptoQuant says new whales now hold about one-third of the whale realized cap.
At $82,134, Bitcoin trades about 6.7% above their cost basis; by simple math, that puts their average entry near $77,000.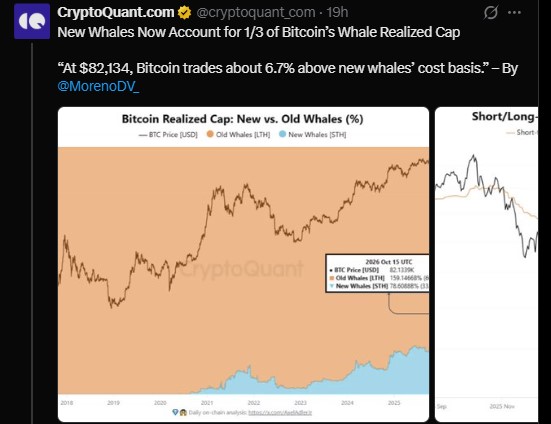
That matters. If price falls toward $76,000 to $78,000, many new whales could be near break-even. Some may sell. Others may buy more. Nobody knows yet.
What Is the Bitcoin Market Sentiment Right Now?
Mood is cautious. CPI, PPI, and Fed events are done, but BTC has not found a clear push higher.
Futures volume fell 22.41%, and the long/short ratio is 0.9826. Traders are not rushing to take big bets in either direction.
On the calmer side, OKX CEO Star Xu said on a podcast that the coin nearly died several times. He listed early forks, hash power attacks, Mt. Gox, scaling fights, and FTX.
In his view, each crisis ended with a stronger industry. Fixing these problems can take months or even a year.
Will Bitcoin Go Up or Down Next?
The short-term bias leans cautious. BTC is under the channel midline, and ETF flows are negative.
Here are three paths traders are watching.
Scenario | Trigger | Possible Levels |
Bearish | Close below $80,000 with rising volume | $78,000, then $76,000 |
Neutral | Support holds, price bounces | $83,000 to $84,000 |
Bullish | Breakout above the channel | $88,000 to $92,000 |
Candle closes, and volume matters more than a quick wick. A fast dip below $80,000 that recovers is not the same as a firm break.
Sudden news can still move the market fast. For now, ETF flows and the $80,000 support zone are the main things to watch.
The chart favors sellers for now. A move above $86,000 would change that view.
Disclaimer
This article is for information only. It is not financial, investment, or trading advice. Crypto prices are volatile, and you can lose money. Do your own research and speak with a licensed financial advisor before you invest. The author and publisher do not hold responsibility for any losses.
















