BlockchainFX Price Prediction: Can BFX Rebound Above $0.000285 Pivot?


BlockchainFX Price Slips 6.48% to $0.000280 as Volume Dries Up
BlockchainFX price fell 6.48% to $0.000280 over 24 hours, with trading volume at just $2.5K.
A decline on thin turnover leaves the market sensitive to small orders, and it sets up a test of support ahead of the Nov 10 token burn. This outlook uses chart-based levels and forecast ranges through December 2026.
BlockFX Post Highlights Indicator-Based Market Analysis
In a post dated Nov 6, 2026, the project said its platform offers more than 100 technical indicators for reading market moves.
The post does not give any BlockchainFX price reading or forecast, so every level below is calculated from the 24-hour chart using two standard tools: pivot points and Fibonacci retracements.
Indicators like these summarize past moves and cannot predict the next one, so they work best as reference points.
Source: Official X Post
Market Snapshot: $0.000280, $10.0K Pool, and $980.8K FDV
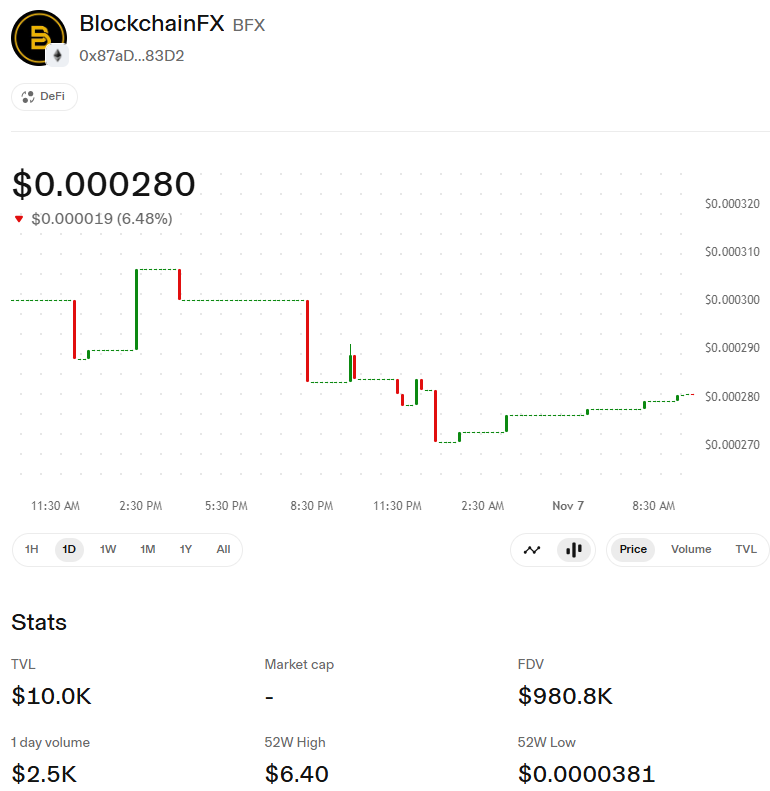
On Ethereum, BFX was quoted at $0.000280 on Nov 7, 2026, down $0.000019 on the day. Market cap is not listed, so fully diluted value (FDV) is the best size gauge.
Metric | Reading |
Current level | $0.000280 |
24-hour change | -6.48% |
24-hour volume | $2.5K |
Pool TVL | $10.0K |
FDV | $980.8K |
52-week high | $6.40 |
52-week low | $0.0000381 |
Volume equals about 0.25% of FDV and 0.25 times pool TVL, so the BlockchainFX price reflects few trades and can gap on modest orders.
Source: Uniswap Chart
Note: Prices can change quickly, so figures may not reflect the latest value. Readers should check a live price tracker for current data.
Where BFX Sits Inside Its 24-Hour Range
24-hour high: near $0.000306
24-hour low: near $0.000270
Range width: $0.000036, or about 12.9% of the current level
Position in range: about 28% above the low
The chart shows a step-by-step slide from $0.000300, with the low reached overnight and small higher steps since. BFX trades in the lower third of its range, a reading that favors caution until buyers lift it past the midpoint.
Pivot and Fibonacci Levels Calculated From the 24-Hour Range
Classic pivot points use the 24-hour high, low, and latest level. Fibonacci zones measure a rebound from the low across the same range.
Marker | Value | Move from $0.000280 | Implied FDV |
Support 2 | $0.000249 | -11.1% | $0.87M |
Support 1 | $0.000265 | -5.4% | $0.93M |
Pivot | $0.000285 | +1.8% | $1.00M |
Resistance 1 | $0.000301 | +7.5% | $1.05M |
Resistance 2 | $0.000321 | +14.6% | $1.12M |
Fibonacci rebound zones from the low:
38.2%: $0.000284
50.0%: $0.000288
61.8%: $0.000292
78.6%: $0.000298
The pivot and the 38.2% zone sit close together near $0.000285, so a daily close beyond that area would be the first sign that the BlockchainFX price is recovering.
Forecast Table: Mid-November, Month-End, and Year-End Ranges
These ranges apply the levels above and widen over time because turnover is thin. They are estimates, not guaranteed outcomes, and the BlockchainFX price can move outside them quickly if one large order arrives.
Horizon | Bear | Base | Bull |
Nov 12, 2026 | $0.000235 to $0.000262 | $0.000265 to $0.000300 | $0.000310 to $0.000360 |
Nov 30, 2026 | $0.000195 to $0.000250 | $0.000250 to $0.000320 | $0.000340 to $0.000430 |
Dec 31, 2026 | $0.000130 to $0.000220 | $0.000220 to $0.000350 | $0.000380 to $0.000560 |
Distance from today’s level at the first horizon:
Bear: -16.1% to -6.4%
Base: -5.4% to +7.1%
Bull: +10.7% to +28.6%
The base path expects BFX to hold between support 1 and resistance 1 through mid-November, with resistance 2 near $0.000321 as the limit of the bull path.
By Dec 31, the bear floor of $0.000130 is about 54% lower than today’s level, and the bull cap of $0.000560 is 100% higher.
What Would Tilt BFX Toward the Bull or Bear Path
Four items can shift the outlook quickly:
A close past $0.000285, then $0.000301, with volume rising beyond $2.5K
A break below $0.000265 on higher turnover
Pool TVL holding at $10.0K or more
The scheduled Nov 10 token burn and any confirmed new total supply
Overall, the BlockchainFX price leans cautious: it trades below the pivot, in the lower third of its range, on very low volume.
A clean move past $0.000301 would change that view, while a drop under $0.000265 would put the lower pivot back in focus. Anyone following the crypto market should rely on on-chain data and official posts rather than a single indicator.
YMYL Disclaimer: This article is for informational and educational purposes only and should not be taken as financial or investment advice. Crypto markets are volatile, and details such as prices, burn plans, or supply figures mentioned here can change over time. Readers should do their own research before making any decisions based on this content.