Is the BlockDAG Listing Confirmed in 72 Hours? What the Post Says

BDAG Holds Near $0.00001892 as Project Counts Down to Trading
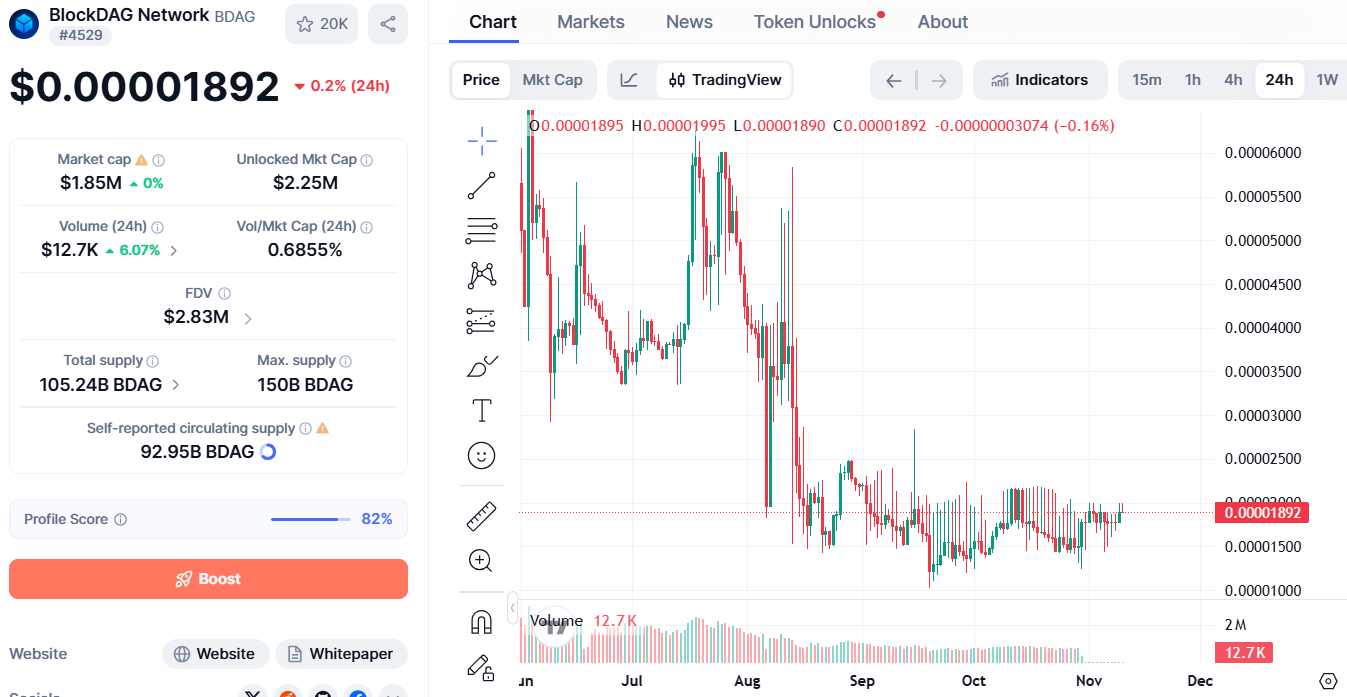
BDAG traded near $0.00001892 on Nov 10, 2026, down 0.2% in 24 hours, according to CoinMarketCap.
A BlockDAG listing is the project’s stated next step. This report studies the chart and scenarios around that window.
What the Nov 10 Post and Website Report
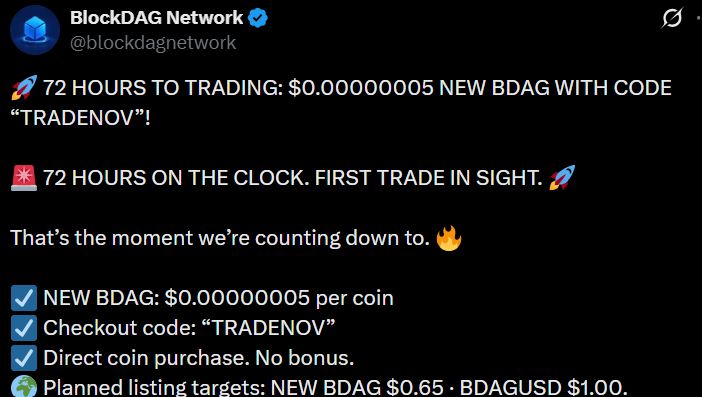
The project’s official X post of Nov 10, 2026, says 72 hours remain until trading begins for NEW BDAG. It calls the first trade in sight and repeats planned listing targets. These are project figures, not market quotes.
The post names no exchange or trading pair, so BlockDAG listing details remain open.
Readers should rely on official channels for any exchange name, pair, and start time. The tracker page labels the token BDAG, while the post uses NEW BDAG.
The project’s website showed 1.42B remaining coins on Nov 10. Its countdown read 2 days, 5 hours, 58 minutes, and 9 seconds.
Source: Official X Post
Market Data Ahead of the BlockDAG Listing Event
Metric | Reading on Nov 10, 2026 |
Quote | $0.00001892 |
24h change | -0.2% |
Market cap | $1.85M |
Unlocked market cap | $2.25M |
24h volume | $12.7K, up 6.07% |
Volume to market cap | 0.6855% |
FDV | $2.83M |
Self-reported circulating supply | 92.95B coins |
Total and maximum supply | 105.24B and 150B coins |
FDV means fully diluted valuation. It estimates value if all 150B coins existed. Market cap rests on self-reported supply, as the tracker notes.
Source: CoinMarketCap Chart
Note: Prices can change quickly, so figures may not reflect the latest value. Readers should check a live price tracker for current data.
Candle Study: A Rejection Just Below 0.00002000
The latest daily candle opened at 0.00001895. It reached a high of 0.00001995 and a low of 0.00001890, then closed at 0.00001892. That is 0.16% below the open.
The high stopped 0.25% short of 0.00002000. The close sat near the low, which chart readers often treat as a sign of selling. Any BlockDAG listing headline would meet that line first.
Activity rose while the quote slipped. Volume gained 6.07% to $12.7K, yet the quote fell 0.2%. More activity without a higher quote suggests buyers did not control the session.
The day’s range spanned 5.56% from low to high. That range formed on just $12.7K of activity, which shows how little money it takes to move the quote.
Trade-Window Scenarios Through Nov 17, 2026
These scenarios tie chart levels to the project’s stated timeline. They do not assume the timeline holds.
Scenario | Trigger | Levels to watch |
Bull | First trades start as stated, and the token closes above 0.00002000 on rising volume | 0.00002150, then 0.00002500 |
Base | The timeline passes with little reaction | 0.00001500 to 0.00002000 |
Bear | The timeline slips, or a daily close lands below 0.00001890 | 0.00001500, then 0.00001250 |
Signals that would shift the range:
An exchange name and trading pair appear in an official post.
Daily volume rises well above the current $12.7K.
A close forms above 0.00002000 or below 0.00001890.
The levels come from the chart axis and are approximate. October highs near 0.00002150 and the September low near 0.00001050 frame the wider range.
A confirmed BlockDAG listing could draw activity toward NEW BDAG instead of the tracked token. The two charts may then move apart.
The base case fits the data best. The 0.00002000 line sits 5.71% above the quote, and 0.00001500 sits 20.72% below it.
Expert Opinion: Listing Headlines and Chart Evidence Differ
A countdown is a statement of intent, not a market event. Chart readers usually wait for an exchange name, a pair and live order books before reading a reaction.
The reviewed posts do not explain how NEW BDAG trading relates to the quote on the tracker.
A BlockDAG listing may change liquidity, but only after trading starts. Until then, the 0.00002000 line and daily volume carry the most weight. A fast reaction to news can fade just as fast when volume stays thin.
Conclusion: Chart Waits on Trading Start and Volume
The token sits just under a line it failed to clear on Nov 10. The project’s stated timeline gives readers a clear window to watch.
A confirmed BlockDAG listing, backed by rising volume, would be the clearest signal.
YMYL Disclaimer: This article is for educational and informational purposes only. It is not financial advice and does not guarantee returns. Price scenarios are chart-based estimates, and crypto markets carry high risk. Readers should research independently before making any decision.