BlockDAG Listing Watch: What Does the Trading Starts Timer Mean?

BDAG Closes at Its Low as the Website Shows a Trading Countdown
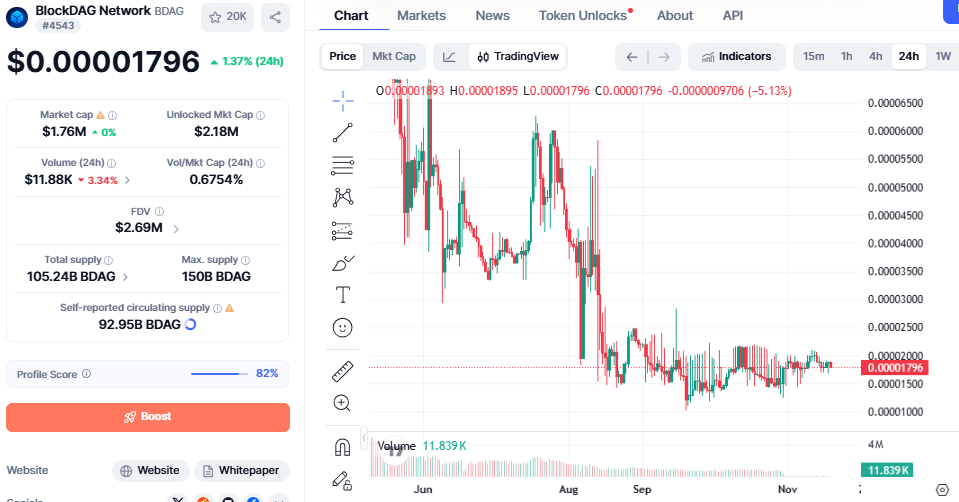
BDAG traded near $0.00001796 on Nov 19, 2026, up 1.37% in 24 hours, according to CoinMarketCap.
The daily candle, however, opened at its high and closed at its low. This report scores the chart signals and asks what a BlockDAG listing would need to change.
What the Website Shows About the CEO Reveal and Trading
The project’s website carries a banner saying the presale is complete and all sales are closed.
A large panel reads “CEO & Team Reveal” and, below it, “Trading Starts”. A countdown of 1 day, 13 hours, 42 minutes and 25 seconds sits under both labels.
The panel names no exchange, trading pair or BlockDAG listing date. The project has not said which event the timer counts toward.
The tracker lists BDAG, which already trades. It shows no market data for NEW BDAG.

Source: Official Website
Is a BlockDAG Listing Priced In? Reading the Signals
A timer beside the words “Trading Starts” invites a simple reading. A pair of labels and a clock is not a listing. A BlockDAG listing needs a named exchange, a trading pair and open order books.
None of the three appears on the page. The chart offers a second check. The quote closed at its low, which does not look like a market pricing in good news.
A third point matters most. BDAG already has a quote, so a BlockDAG listing of NEW BDAG would create a separate chart. It would not by itself lift this one.
Mirror Day: Open at the High, Close at the Low
The latest daily candle opened at 0.00001893 and reached a high of 0.00001895. It closed at 0.00001796, which was also the day’s floor. That is a 5.13% fall from the open.
The tracker shows +1.37% over 24 hours, while the candle shows -5.13%. The two cover different time windows.
Quote: $0.00001796, up 1.37% in 24 hours.
Market cap: $1.76M, against an FDV of $2.69M. FDV means fully diluted valuation.
Unlocked market cap: $2.18M.
24h volume: $11.88K, down 3.34%, equal to 0.6754% of market cap.
Sellers held control from the open to the close, and volume fell as they did. A fall on shrinking activity shows how little money moves this quote.
Source: CoinMarketCap Chart
Note: Prices can change quickly, so figures may not reflect the latest value. Readers should check a live price tracker for current data.
Signal Scorecard and Paths for the Next Seven Days
The scorecard rates five signals as of Nov 19, 2026. A lean is a reading of the evidence, not a forecast.
Signal | Reading | Lean |
Candle shape | Open at the high, close at the low | Bearish |
Volume | Down 3.34%, under 1% of market cap | Neutral |
Resistance | 0.00001893 is 5.40% above, 0.00002000 is 11.36% above | Bearish |
Support | 0.00001500 is 16.48% below, 0.00001250 is 30.40% below | Neutral |
Listing details | No exchange, pair or date shown | Neutral |
Three signals lean neutral and two lean bearish. No signal leans bullish. The paths below turn that count into scenarios through Nov 26, 2026. Levels come from the chart axis and are approximate.
Base path: candles stay between 0.00001500 and 0.00001893 while no details appear.
Bear path: a daily close below 0.00001796 points to 0.00001500, then 0.00001250.
Bull path: a daily close above 0.00001893 with rising volume opens 0.00002000, then 0.00002200. That is 11.36% and 22.49% above the close.
The base path fits best. A confirmed exchange and pair would move the bull path into focus.
Expert Take: Labels and Clocks Do Not Set a Trend
Chart readers usually give more weight to a close and its volume than to a banner. A one-way day proves little by itself. They wait for a second close to confirm or reject it.
A BlockDAG listing may bring liquidity, yet only after the project publishes a venue and a pair. Until then, the 0.00001796 floor and the 0.00001893 open frame the next test. Both a rebound and a deeper drop remain possible.
Conclusion: The 0.00001796 Level Frames the Week Ahead
BDAG closed at the bottom of its range after a 5.13% fall, and the website timer still names no venue.
A close back above 0.00001893, with rising volume, would improve the reading. A published BlockDAG listing would be the clearest signal of all.
YMYL Disclaimer: This article is for educational and informational purposes only. It is not financial advice and does not guarantee returns. Price scenarios are chart-based estimates, and crypto markets carry high risk. Readers should research independently before making any decision.
















