Can a BlockDAG Listing Lift BDAG Above $0.0000200 This November?

BDAG Trades Near $0.0000189 With No Fresh Project Update
BDAG traded near $0.00001888 on November 2, 2026, up 0.79% in 24 hours. A BlockDAG listing has still not been confirmed by the project or any exchange.
This outlook reads the five-month daily chart and tests three November scenarios.
What the Project Has Not Confirmed as of November 2
The project’s November 1, 2026, X post named no exchange and gave no trading date. Nothing newer has appeared as of November 2. That leaves the BlockDAG Listing as an announced plan, not a confirmed event.
Website timer: 11 hours, 34 minutes, and 38 seconds, with no exchange date beside it.
Remaining presale coins: 248.46M, with NEW BDAG at $0.00000000025.
Planned targets from the project: $0.65 for NEW BDAG and $1 for BDAGUSD.
Exchange status: teased, not confirmed.
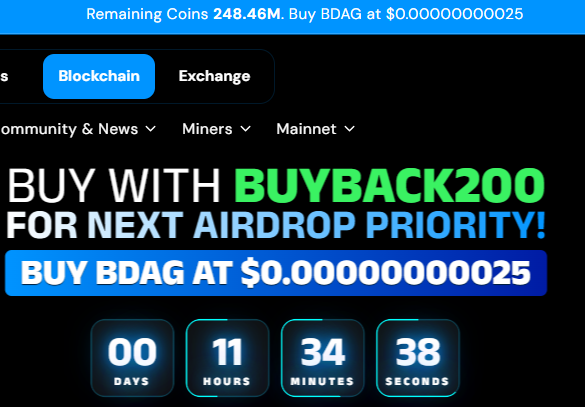
Source: Official Website
Five Months of BDAG Candles on the Daily Chart
Levels in this section are read by eye from the chart, so they are approximate. The CoinMarketCap daily chart shows the token near $0.0000600 in July, after trading even higher in June.
A steep drop in early August cut the quote to near $0.0000200 within days. From the July peak to today, the drop equals roughly 69%.
Since late August, the token has moved sideways between about $0.0000110 and $0.0000245. Volume bars are also visibly smaller than in June and July. The top of that range sits about 123% above its floor.
The latest daily candle opened at $0.00001901 and sits at $0.00001888. Its high was $0.00001997, and its low was $0.00001880. The tracker page shows +0.79% over 24 hours, while this candle shows -0.68% from its open.
Level | Zone | What the chart shows |
Resistance | $0.0000245 | Top of the range since late August |
Resistance | $0.0000220 | Repeated highs inside the range |
Resistance | $0.0000200 | Sits just above today’s high |
Support | $0.0000150 | Cluster of September and October lows |
Support | $0.0000125 | Low seen in late October |
Support | $0.0000110 | Bottom of the range |
Why Volume Matters More Than a BlockDAG Listing Date
Metric | Value on November 2, 2026 |
Latest quote | $0.00001888, up 0.79% |
Market cap | $1.84M |
Unlocked market cap | $2.25M |
Fully diluted valuation (FDV) | $2.83M |
24-hour volume | $13.58K |
Volume to market cap ratio | 0.7377% |
Self-reported circulating supply | 92.93B |
Total supply | 105.22B |
Max supply | 150B |
Volume of $13.58K equals about 0.74% of market cap in 24 hours. That is thin, so a few thousand dollars of orders would move the quote.
A BlockDAG Listing could add venues and trading depth. It would not guarantee demand, and the project has set no date.
The tracker lists max supply at 150B, about 61% above circulating supply. Any future issuance would add supply if demand stays flat. Trackers count supply differently, so figures vary between sites.
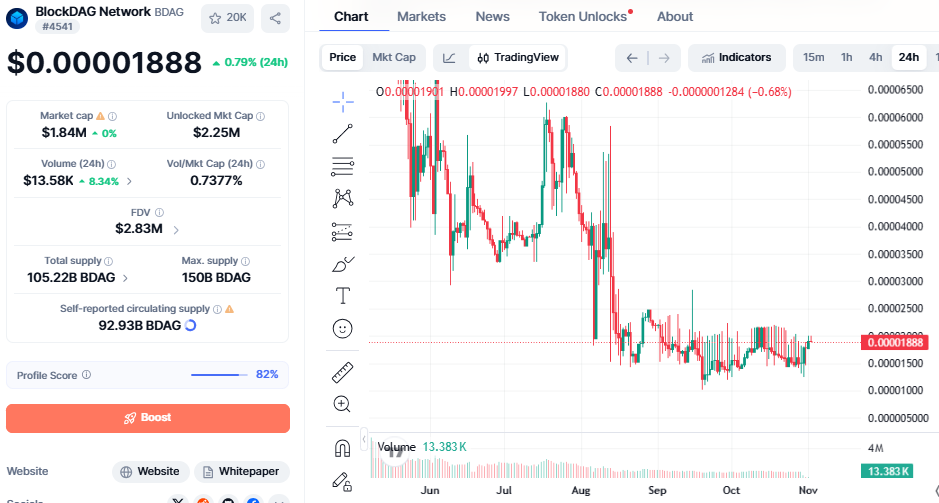
Source: CoinMarketCap Chart
Note: Prices can change quickly, so figures may not reflect the latest value. Readers should check a live price tracker for current data.
BDAG Price Prediction Zones for November 2026
Each zone starts from the $0.00001888 quote on November 2, 2026, and treats the BlockDAG Listing as unconfirmed.
Scenario | Trigger | Zone | Move from quote |
Bull | Daily close above $0.0000220 with rising volume | $0.0000245 to $0.0000300 | +30% to +59% |
Base | Quote holds above $0.0000150 and below $0.0000220 | $0.0000150 to $0.0000220 | -21% to +17% |
Bear | Daily close below $0.0000150 | $0.0000110 to $0.0000125 | -42% to -34% |
The base case fits best, since BDAG has stayed inside a wide range since late August. A drift toward $0.0000200 would test the nearest resistance first.
A bull move needs a daily close above $0.0000220, a level the range has capped before. More buying interest would be the key sign, since trading is thin. A confirmed BlockDAG listing date could help that case.
A bear move starts with a daily close below $0.0000150. The late October low near $0.0000125 would then come into view, followed by $0.0000110. A fall to the lowest zone would cut the quote by about 42%.
Four signals would shift the zones:
A named exchange and a trading date from the project.
Volume moving well above $13.58K.
A close outside the $0.0000150 to $0.0000220 range.
Any change to total or max supply figures.
Expert Opinion on BDAG Liquidity and Chart Risk
The chart shows a long downtrend that flattened into a range, with volume fading. Ranges can break in either direction, so levels need confirmation from a daily close.
Small markets also react sharply to single orders, which can distort any chart pattern. A confirmed BlockDAG listing would give analysts a firmer base than timers do.
What Could Change the BDAG Outlook After November 2
The token sits inside a broad band, with thin trading and no confirmed exchange news. The BlockDAG Listing remains the main open question for this market.
Readers can follow the project’s official X account for dated updates. Any new post will test these zones fast.
YMYL Disclaimer: This article is for educational and informational purposes only. It does not offer financial advice, price guarantees, or return promises. Crypto assets are volatile, so readers should research independently before making decisions.