Why Is BDAG Still Falling, Can $0.5 Return? BlockDAG Price Prediction!

BlockDAG Price Prediction discussion today skips the promotional countdowns this coverage has tracked before and looks instead at the plain technical picture: BDAG at $0.00001602, a multi-month downtrend visible on the chart, and a $0.5 recovery question that requires being honest about scale before anything else.
Is BDAG Actually Falling Today, or Just Over a Longer Window?
Worth separating these two readings clearly. Today's own 24-hour change is essentially flat, up just 0.08%.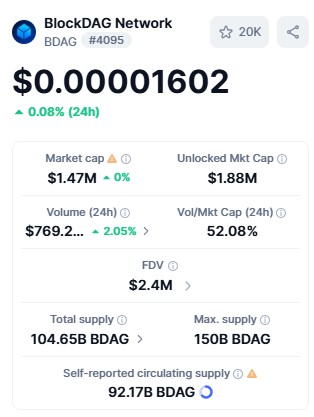
Source: BDAG live stats, captured September 18, 2026
The "still falling" framing reflects a longer window: The historical data shows BDAG declining from roughly $0.00002212 on September 1 to $0.00001789 on September 16, about 19.1% over two weeks, and today's $0.00001602 continues that trend slightly further.
The chart's broader view tells the same story at a larger scale, a sustained decline from levels above $0.0001 back in May down to today's price.
What's Actually Driving the Multi-Month Decline?
A few factors stand out from the confirmed data itself, without needing to speculate beyond it.
Today's Vol/Mkt Cap ratio of 52.08% is unusually high, meaning daily trading volume equals more than half of BDAG's entire market cap, a pattern more consistent with speculative, unstable trading than steady accumulation.
Market cap itself carries a self-reported flag on the dashboard, and circulating supply (92.17B BDAG) remains project-disclosed rather than independently audited, both of which limit how much confidence can be placed in the headline market cap figure.
This coverage has also tracked a string of promotional claims from BlockDAG Network over recent updates that have not been shown to produce sustained price support once their windows passed, relevant background for why price has continued drifting down despite periodic announcements.
Chart Levels: Where BDAG Sits Now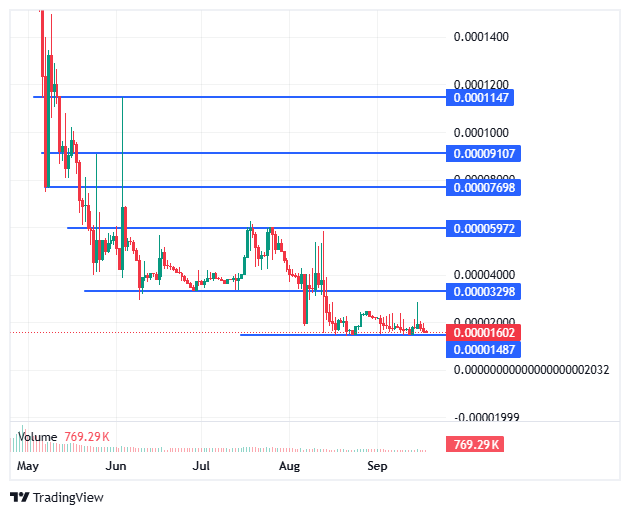
Source: BDAG price chart, captured September 18, 2026
Level | Price | Multiple from $0.00001602 |
Resistance | $0.0001147 | 7.16x |
Resistance | $0.00009107 | 5.69x |
Resistance | $0.00007698 | 4.81x |
Resistance | $0.00005972 | 3.73x |
Resistance (nearest) | $0.00003298 | 2.06x |
Current Price | $0.00001602 | — |
Support (nearest) | $0.00001487 | — |
How Low Could $BDAG Go from Here?
The nearest support sits at $0.00001487, about 7.2% below price. If that level breaks on continued selling, similar to the pattern behind the 19.1% decline over the past two weeks, the chart does not mark a lower support level below that point, meaning price would be moving into less-charted territory rather than testing a previously established floor.
Can BDAG Actually Recover to $0.5?
This needs to be treated as a highly speculative, long-term scenario, not a target grounded in current momentum. Moving from $0.00001602 to $0.5 requires roughly a 31,211x increase.
At BDAG's 150 billion max supply, a $0.5 price would imply an FDV near $75 billion, against today's confirmed $2.4 million, a scale of valuation growth with no supporting catalyst in data.
Even clearing the charts nearest resistance, $0.00003298, just over 2x from here, is a more immediate and separate question from anything involving $0.5.
BlockDAG Network Price Prediction: Near-Term Scenarios
BlockDAG Price Prediction points to a bear case of $0.00001487–$0.00001602, a base case of $0.00001602–$0.00002212, and a bull case of $0.00002212–$0.00003298, anchored to today's price and CoinGecko's recent historical range.
Scenario | BDAG Price Range | Key Driver | Invalidation |
Bear Case | $0.00001487–$0.00001602 | The multi-week decline continues toward the nearest chart support | A sustained close back above $0.00001602 counters this |
Base Case | $0.00001602–$0.00002212 | Price stabilizes and reclaims the level seen as recently as September 1 | Price falling below $0.00001487 and holding |
Bull Case | $0.00002212–$0.00003298 | A volume-confirmed recovery clears the nearest chart resistance | Requires sustained volume well beyond today's elevated but unstable Vol/Mkt Cap pattern |
BlockDAG Price Prediction: Path to $0.5: A Staged Reality Check
Milestone | Multiple from $0.00001602 | What It Would Require |
Clear nearest resistance ($0.00003298) | ~2.06x | A reversal of the current multi-week downtrend on sustained volume |
Clear mid-range resistance ($0.00007698) | ~4.81x | Demand well beyond anything in current volume or FDV data |
Clear highest marked resistance ($0.0001147) | ~7.16x | A level not seen on this chart since earlier in the year |
Reach $0.5 | ~31,211x | An FDV near $75 billion, a scale unsupported by any confirmed fundamental in today's data |
Disclaimer
Informational purposes only, not financial advice. $BDAG trades at $0.00001602, continuing a multi-week decline confirmed by CoinGecko's historical data (down from about $0.00002212 on September 1). Market cap is self-reported and flagged; circulating supply is not independently audited. A $0.5 recovery would require an approximately 31,211x increase and an FDV near $75 billion, a scale unsupported by current data. Price predictions are pattern-based estimates, not guaranteed outcomes. Cryptocurrency carries a significant risk of loss.


















