Cardano Price Prediction: ADA Rebounds From $0.2114, What Next?

Did ADA's longs just get shaken out right before a real bounce?
This Cardano price prediction starts at $0.2206 on October 19, 2026, 09:10 UTC, after a dip to $0.2114 that hurt long traders badly. It follows the last Cardano forecast, which leaned bearish below $0.2263.
Buyers stepped in. But the 200 EMA, a long-term moving average, still sits overhead, and the next few sessions may decide whether the bounce holds.
Cardano Price Today: Market Snapshot
Fresh Cardano price today's numbers come from CoinMarketCap and CoinGlass at October 19, 2026, 09:10 UTC.
Metric | Value |
Price | $0.2206 |
24H change / range | +0.93% / $0.2114 to $0.2224 |
7D / 30D / 90D | -12.45% / -1.75% / +29.93% |
Market cap | $8.12B |
24H volume | $258.04M (+14.75%) |
Volume rose while price barely moved, per CoinMarketCap market data. That's a tug of war.
Yesterday's Prediction: Target vs. Actual Result
October 17, 2026, 09:20 UTC to October 19, 2026, 09:10 UTC, using the 24H range and Binance 30-minute chart.
Scenario | Target | Actual | Status |
Bear | Lose $0.2217, aim $0.2162 then $0.2159 | 24H low $0.2114, both levels broken | Hit |
Bull | Reclaim $0.2271, test $0.2334 | 24H high $0.2224, no move above $0.2271 | Not Hit |
Base | Range $0.2217 to $0.2263 | Price at $0.2206, under the range floor | Not Hit |
Bears won this round. The bearish lean held, and the rebound stalled at $0.2224.
Why Is Cardano Moving Today?
Sharp flush first. Then a sharper snap back. ADA tagged $0.2114, then buyers pushed it to $0.2206.
Liquidations, forced exits when a trade can't cover its margin, hit $1.49M. Longs took $1.35M of that. But volume climbed 14.75%, so the rebound had real participation.
Cardano News Today: Events and CIP Updates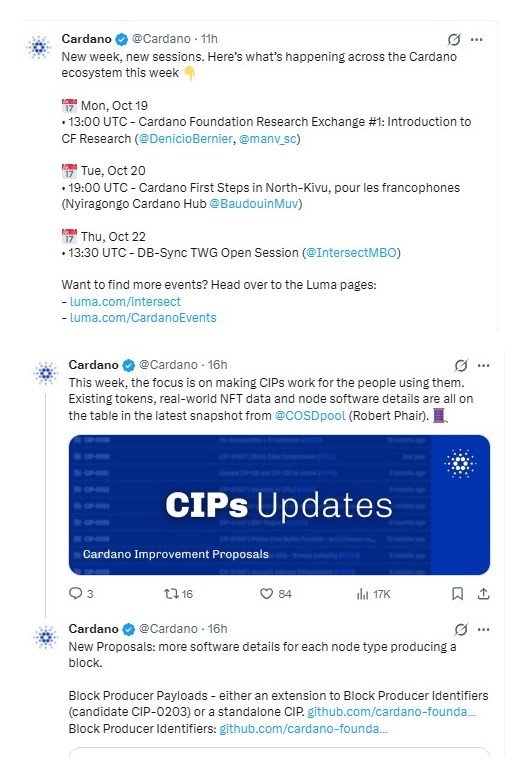
Nothing on the calendar moves the price by itself. But Cardano news today keeps the ecosystem busy, per the official Cardano X post.
Cardano Foundation's Research Exchange #1 starts October 19, 2026, at 13:00 UTC, and a DB-Sync TWG open session follows October 22 at 13:30 UTC.
A separate update covers CIPs, or Cardano Improvement Proposals, including candidate CIP-0203. Slow-burn stuff.
Cardano Technical Analysis: Descending Channel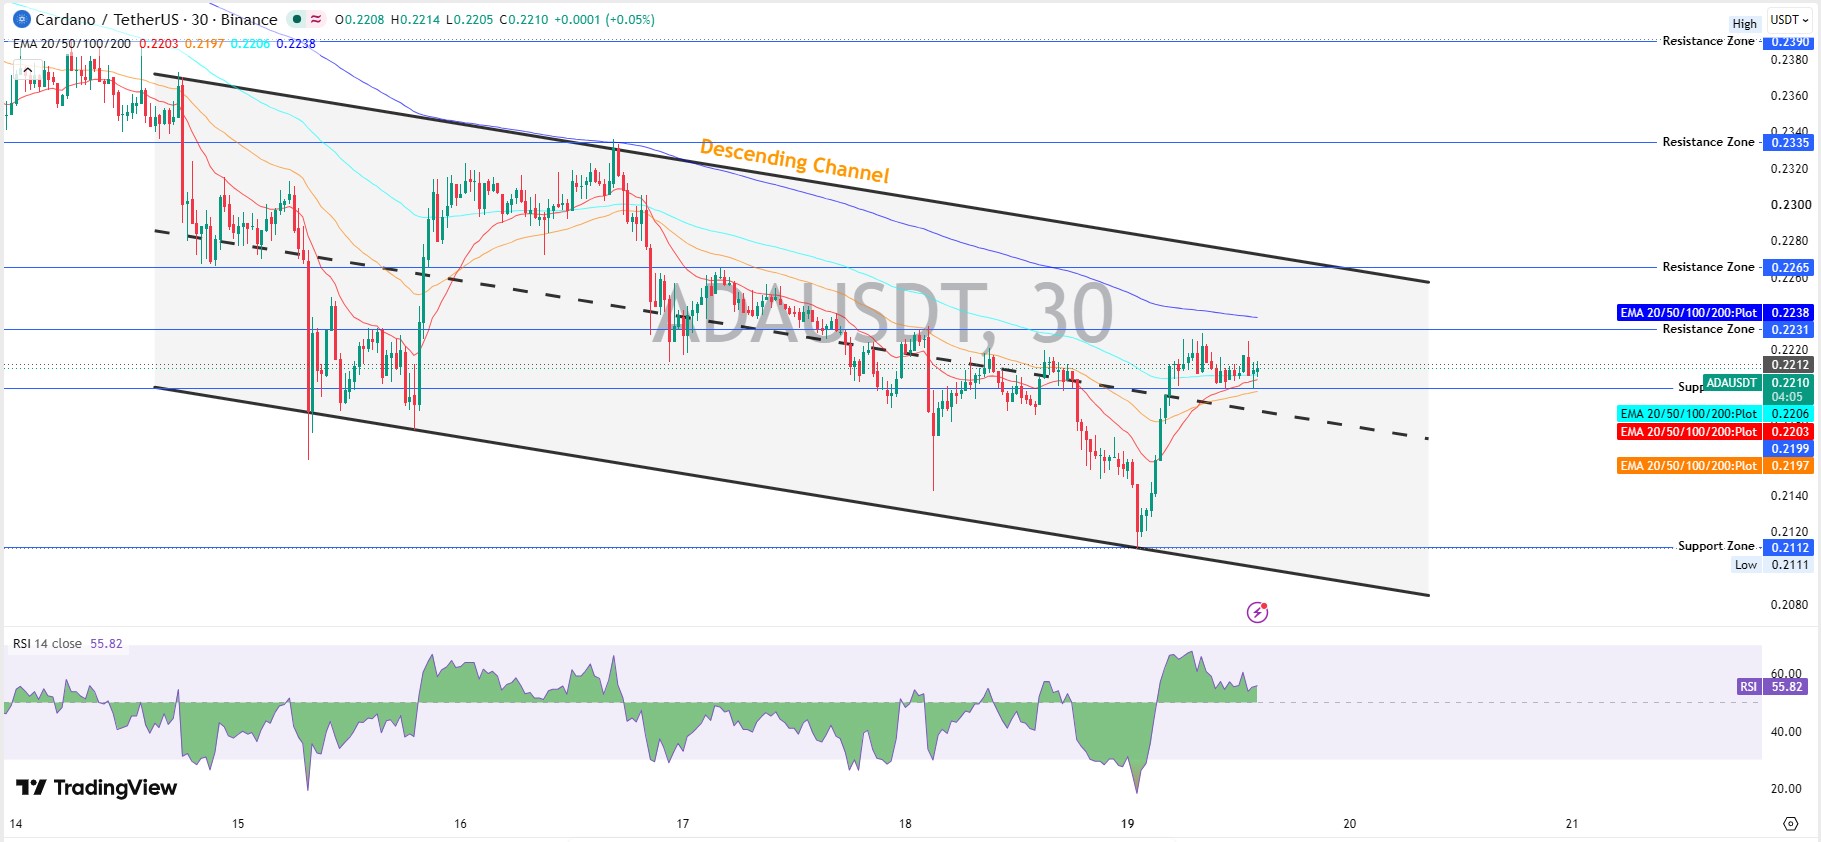
This Cardano technical analysis uses the TradingView ADA chart for Binance ADA/USDT on the 30-minute timeframe.
Price trades inside a descending channel, a lane of lower highs and lower lows, hugging the dashed midline. RSI reads 55.82. Above 50 gives bulls a mild edge.
The 20 EMA, 50 EMA, 100 EMA, and 200 EMA sit at $0.2203, $0.2197, $0.2206, and $0.2238.
ADA trades above the first three and under the 200 EMA. That's the same wall flagged in the 200 EMA resistance setup.
Key Support Levels
Support is a zone where buyers stepped in before. First sits $0.2199, then $0.2112. A hold above $0.2199 keeps the midline alive, a pattern covered in the midline retest analysis.
Key Resistance Levels
Resistance is where sellers tend to appear. First comes $0.2231, then $0.2265, $0.2335, and $0.2390.
The 200 EMA at $0.2238 sits right above the first wall. That completes the ADA support and resistance map.
ADA Futures Data: Who's Crowded?
CoinGlass ADA data shows futures volume at $393.20M and open interest, the total value of open contracts, at $466.04M.
Binance accounts run a long/short ratio of 1.8686, and OKX reads 2.56. Longs outnumber shorts nearly two to one. So who's left to buy if longs get flushed again?
Futures Volume by Exchange
Binance leads at $137.83M, then MEXC at $77.91M. Liquidity shifts fast, so exchange listing updates matter.
Binance-Peg ADA Holders: Whale Concentration
BscScan holder data tracks Binance-Peg ADA, the BNB Chain version of the coin.
Fifty-three whale wallets, 71.74% of that supply. Concentration like that cuts both ways. Binance Hot Wallet 20 alone holds 23.54%. That's exchange custody, not conviction.
Bitcoin Backdrop: Is BTC Helping ADA?
BTC trades at $82,686.69, up 0.99%, with volume up 88.23%. A steady Bitcoin gives altcoins room, though it guarantees nothing. And smaller tokens react first to sentiment shifts, as memecoin crypto news often shows.
Cardano Price Prediction: Bull, Base, and Bear Scenarios
This ADA price prediction leans bearish below $0.2238. The bounce is a reversal. Actually, no: price still trades under the 200 EMA, so it's repair work.
Scenario | Trigger | Targets | Invalidation | Timeframe | Liquidity condition |
Bull | Trades above $0.2238 | $0.2265, then $0.2335 | Trades below $0.2199 | 3 to 7 days | Volume above $258.04M |
Base | Trades hold $0.2199 to $0.2231 | Range chop | Break either side | 24 to 72 hours | Volume flat |
Bear | Trades below $0.2199 | $0.2112 zone | Reclaims $0.2231 | 1 to 5 days | Selling volume rising |
Bull Case
A hold above $0.2199, plus rising volume. That's the bull checklist.
Under this scenario, the first $ADA price target is $0.2265.
Base Case
Chop between $0.2199 and $0.2231 may last a day or two.
Bear Case
Sellers have a clear target: the $0.2112 zone.
Cardano Price Prediction 2026: Year-End View
ADA is down 33.72% year to date and 65.23% over one year, yet up 29.93% over 90 days.
A Cardano price prediction for the 2026 year-end view hinges on one test, trades above $0.2390. Losing $0.2112 would keep the downtrend alive.
Supply Check: Does Dilution Matter?
About 82% of the 45B maximum supply, 36.81B ADA, already circulates. FDV, the market cap if every coin existed today, reads $9.92B.
Token cliffs like the Starknet unlock event can swing charts overnight. Nothing in the data points to one for $ADA.
Risks That Could Change the Cardano Price Prediction
Crowded longs, a falling channel, and thin follow-through. That mix rarely ends quietly.
And attention can rotate toward AI crypto news themes, draining flows from altcoins.
Final Takeaway
This $ADA price forecast stays bearish under $0.2238. A hold above $0.2199 keeps bulls in the game. More setups sit in crypto price predictions.
Disclaimer: This article is for information only and isn't financial advice. Crypto is volatile, and losses can be total. Price predictions are opinions that can't guarantee future results. Research independently before investing.