Crypto market news: $773M liquidations Slam Bitcoin and Ether Bulls


Crypto market news: $773M Liquidation Wave Wipes Out Bullish Bets
Bitcoin and Ether dropped sharply in a sudden move on November 8, 2026, forcing exchanges to close hundreds of millions of dollars in leveraged bets.
Tracker data shows it was one of the heaviest single days of forced selling in recent weeks, and almost all of it hit bullish traders.
This crypto market news report covers the price move, the numbers from two independent trackers, the coins and exchanges affected.
What Happened: The Flash Move
Charts of both leading coins show one oversized red candle followed by smaller recovery candles.
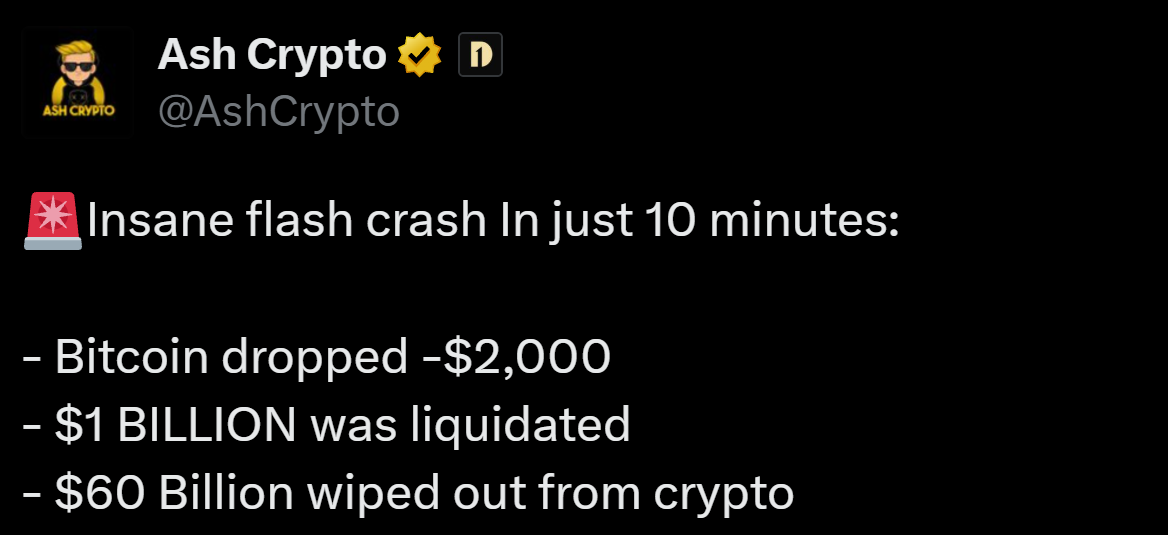
Source: Post on X
Reading the charts, Bitcoin slid from near $75,600 to near $74,100, with a wick reaching roughly $73,500. Ether fell from near $2,218 to near $2,124, with a wick near $2,070.
| Asset | Start | Candle close. | Lowest wick | Wick drop |
| Bitcoin | $75,600 | $74,100 | $73,500 | About 2.8% |
| Ether | $2,218 | $2,124 | $2,070 | About 6.7% |
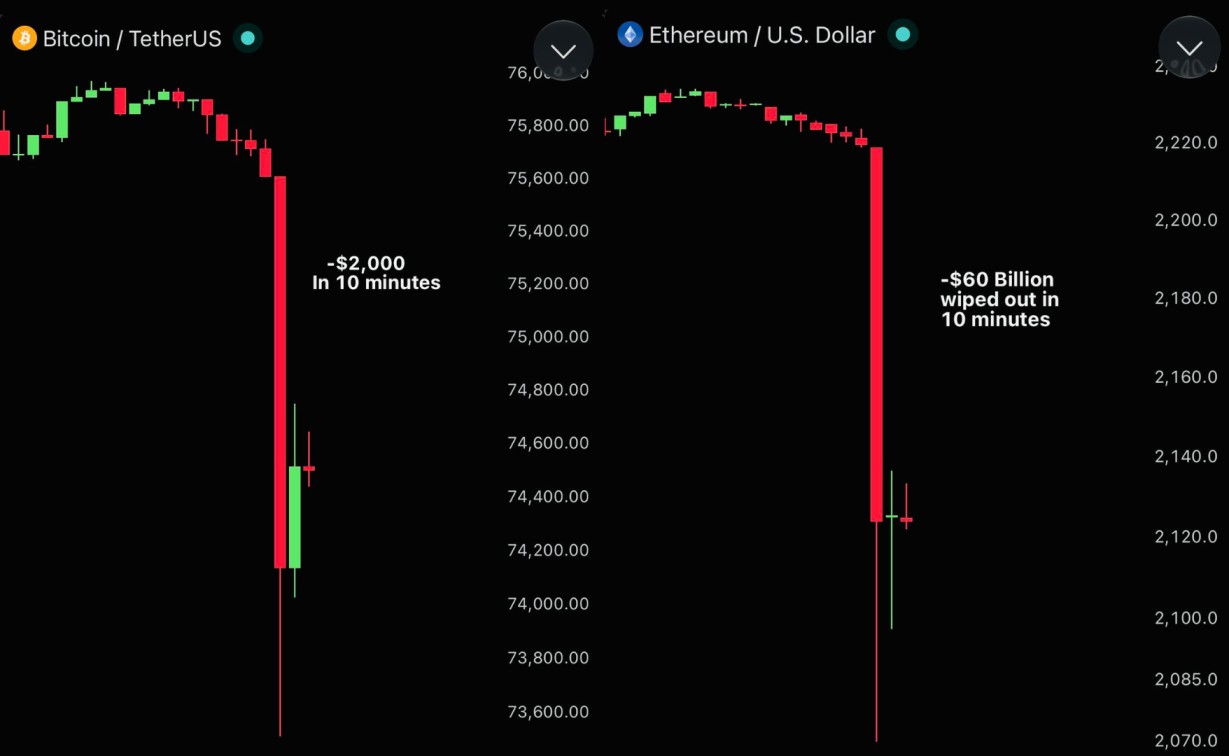
Both coins then bounced partway, BTC back near $74,500 and ETH near $2,125.
The price levels are chart estimates rather than exchange-confirmed figures.
The Liquidation Data: How Big Was the Wipeout?
In any crypto market news, forced closures are the key number to watch.
A liquidation happens when an exchange force-closes a leveraged position because the trader’s margin can no longer cover the loss.
Two trackers recorded the event, using different windows and methods, so their totals differ slightly.
| Metric | Daily tracker, Nov 8 UTC | 24-hour dashboard, to 06:12 UTC Nov 9 |
| Total forced closures | $773.0M | $750M |
| Longs | $712.4M (92.2%) | $700M (93%) |
| Shorts | $60.6M | $50.0M |
| Bitcoin | $220.8M | $265M |
| Ether | $351.1M | $315M |
| Peak | $48.2M single ETH long | $644M in one hour |
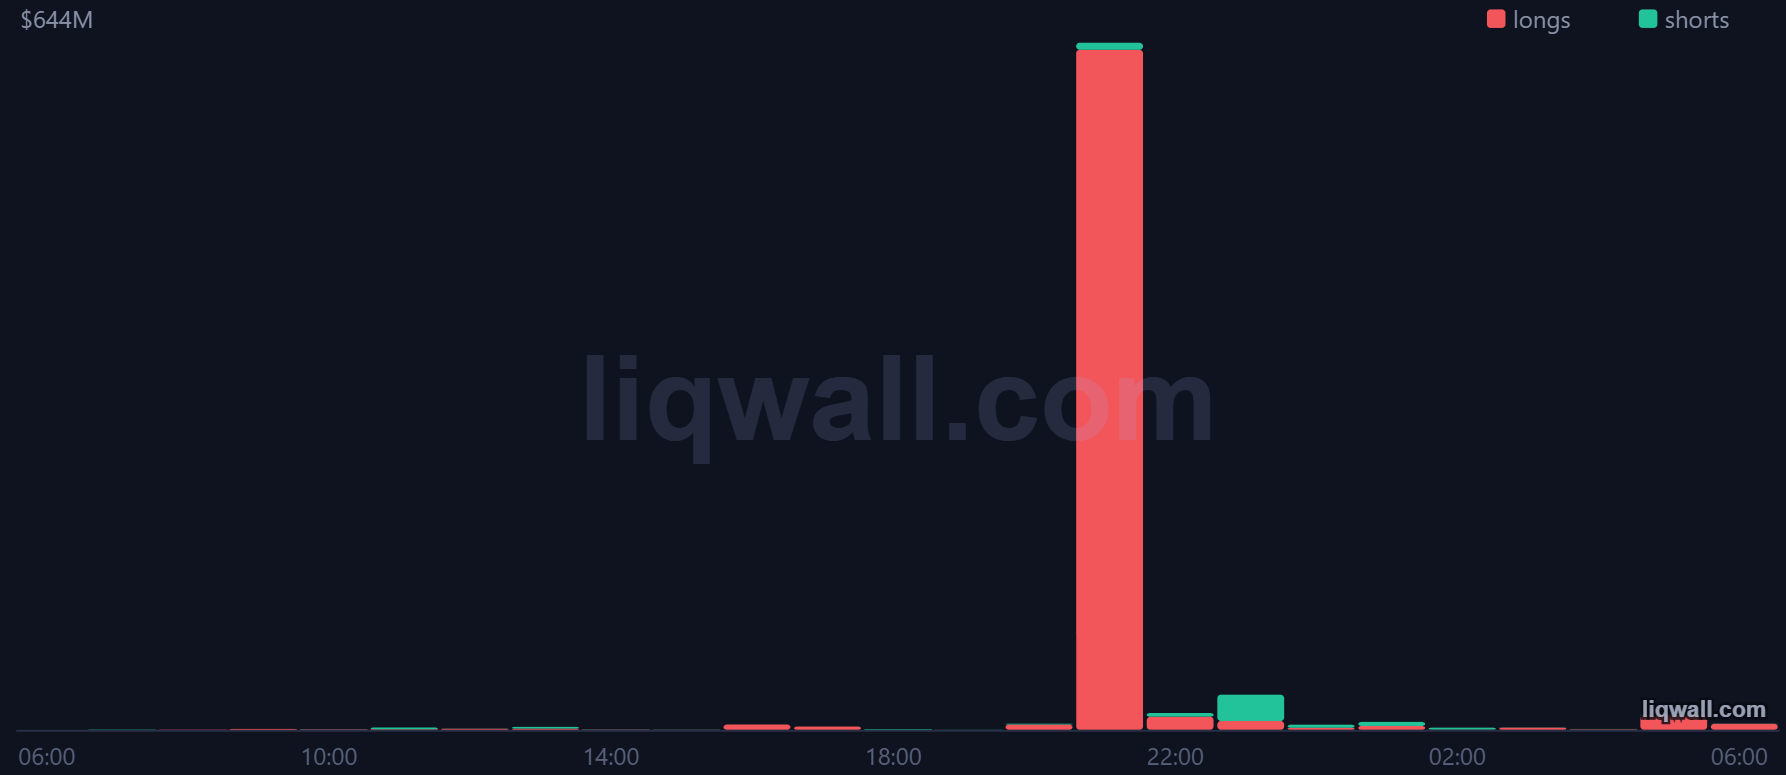
The dashboard says the busiest hour ran from 21:00 to 22:00 UTC, and the daily tracker places its largest single closure, a $48.2M ETH long on Binance at $2,095.5, at 21:55 UTC.
That price sits just above the chart’s ETH wick, which fits the picture. The daily tracker notes its totals are a lower bound because some exchanges only publish samples.
Which Coins and Exchanges Took the Hit
The daily tracker shows ETH led with $351.1M, followed by BTC at $220.8M. Most of the pain came from bullish bets:
-
ETH: 93.8% of its $351.1M came from longs
-
BTC: 95.0% of its $220.8M came from longs
-
Solana: $27.9M, with 98.0% longs
-
XRP: $26.1M, with 98.4% longs
By venue, Binance had $468.4M, Bybit $152.6M, and Gate $75.0M in the daily data.
The 24-hour dashboard, which counts differently, lists Hyperliquid at $253M and Binance at $245M. Across seven exchanges, the daily tracker recorded 121,629 closed orders.
Why Leverage Amplified the Drop
The daily tracker calls November 8 the largest liquidation day since its tracking began on September 27, at 3.1 times the average of the previous seven full days ($252.7M).
The dashboard lists the date among its largest since September 4, behind October 8, October 29, and September 21, but ahead of October 15.
The mechanism behind the crypto market news is simple. Traders who borrow to buy are forced out when prices dip.
Those exits are market sellers, which push prices lower, which trips the next group of stops.
With about 92% of the total coming from longs, the crowd was clearly positioned for higher prices.
Roughly 89% of the dashboard’s November 8 total ($720M) landed inside a single hour.
That hour fell around 4 to 5 p.m. U.S. Eastern time on a Sunday, a stretch when fewer traders are active and each large sell order moves prices further.
Conclusion
The data tells a clear story: a fast price drop, a spike in forced closures, and an overwhelming share of bullish positions erased.
This crypto market news was steep but partly reversed in the candles that followed, a pattern common after leveraged unwinds.
Readers should rely on verified price data and tracker totals, remembering that figures vary by method. None of this is investment advice.
Disclaimer
This article is for educational and informational purposes only and is not financial or investment advice. Crypto assets are high risk, their prices can be very volatile, and you can lose some or all of your money. Always do your own research and consider speaking with a licensed financial advisor before making investment decisions.






