Dogecoin Price Prediction: 545M DOGE Whale Claim vs a 3.2% Price Drop


The Dogecoin price prediction October 2026 debate has two loud headlines pulling in opposite directions. Whales reportedly bought over 545 million DOGE in a day, yet the price fell 3.2%.
Dogecoin launched in December 2013 by Billy Markus and Jackson Palmer as a joke based on the Shiba Inu meme. Over the years it has become one of the largest meme coins by market value.
For the latest Dogecoin price today, the Dogecoin coin trades at $0.0931, down 3.2% over 24 hours. It ranks #12 by market cap at $14.535B, and its 24-hour range runs from $0.09051 to $0.09785.
Dogecoin Live Data
Metric | Value |
Price | $0.0931 |
24h Change | -3.2% |
24h Range | $0.09051 - $0.09785 |
Market Cap | $14.535B |
Market Cap Rank | #12 |
Source: market data taken from CoinGecko, as of Oct 3, 2026. Figures may vary slightly across other tracking websites.
Dogecoin (DOGE) News Today
The latest Dogecoin news has two parts. The first is a post claiming that whales bought more than 545 million $DOGE over the last 24 hours. At the current price, that would be worth about $50.7M.
The post names no wallets, exchanges, or data sources, so the figure cannot be verified. It also sits oddly beside a 3.2% daily drop, because strong buying would normally support price.
Source: Data Taken From @Investment_CEO, X Account, as of Oct 3, 2026
The second story comes from BSCN, which reported that Kalshi, a CFTC-regulated venue, is listing DOGE perpetual futures. The product is pitched as an onshore alternative to offshore platforms.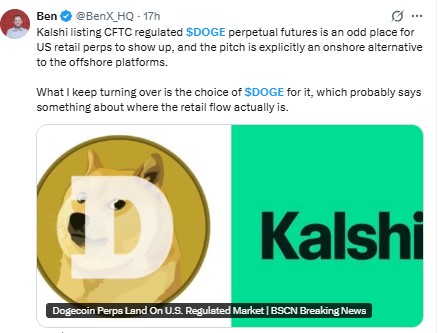
Source: Data Taken From @BenX_HQ, X Account, as of Oct 3, 2026
Neither post shows any volume or price reaction yet. Traders should treat both as headlines, not confirmed demand.
Dogecoin (DOGE) Technical Analysis
This Dogecoin technical analysis uses the 4-hour (4H) DOGEUSDT chart on Binance, captured at 11:00 IST on October 3, 2026.
The current 4H candle was still open at capture and closes at about 13:30 IST (08:00 UTC).
Price sits inside a descending triangle. A falling trendline from the September 22 high presses down on a flat floor at $0.09128.
A long red candle dipped slightly under that floor on October 2 to 3, and the price then recovered above it.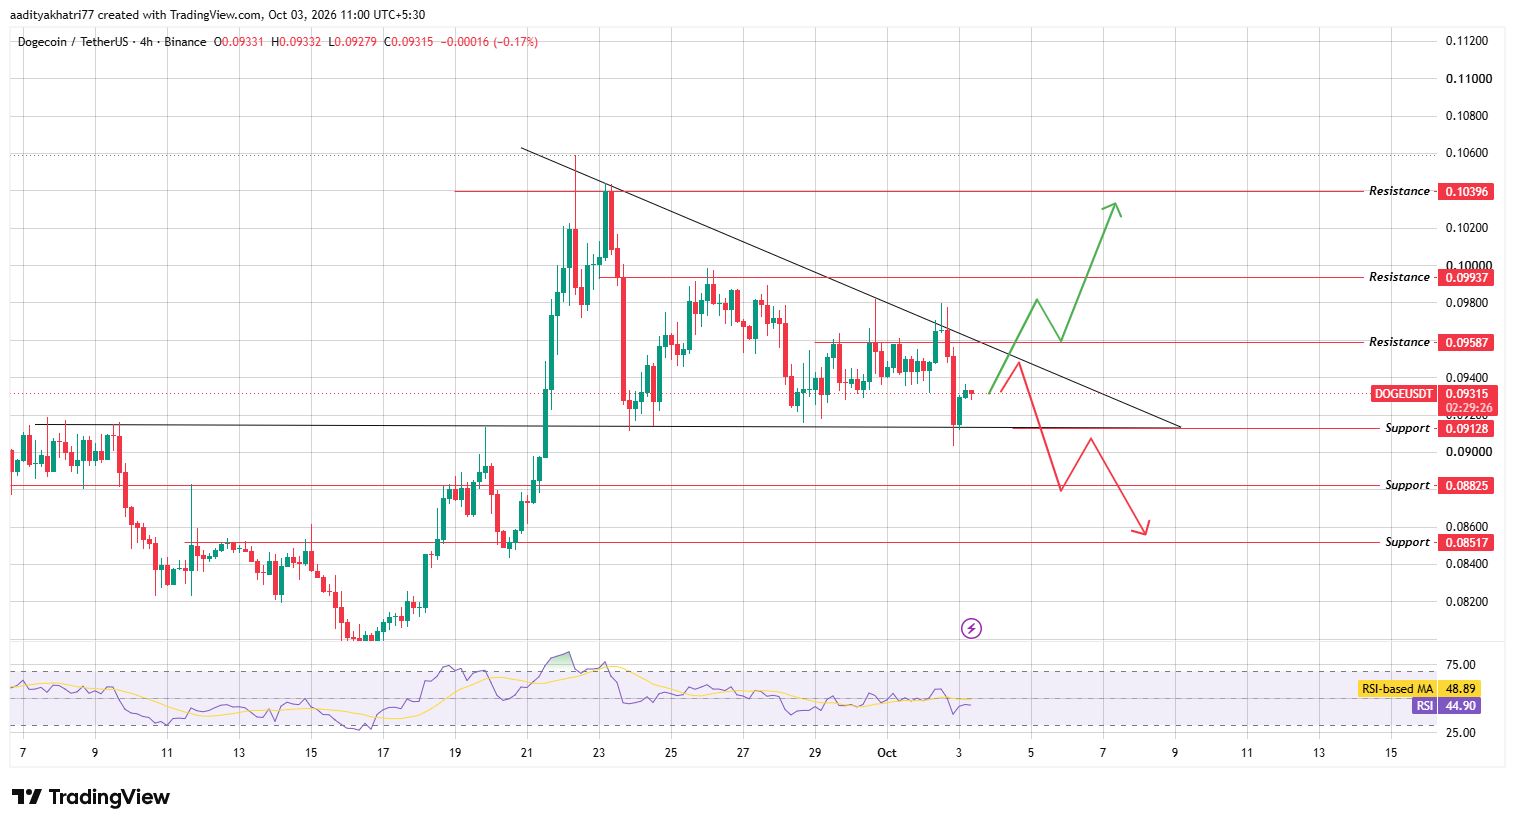
Source: Chart taken from TradingView, Binance DOGEUSDT, October 3, 2026
The chart price of $0.09315 differs slightly from the CoinGecko figure because of timing.
The RSI reads 44.90 and sits below its moving average at 48.89. That points to soft momentum with a slight lean toward caution, not an extended move in either direction.
The first test is the falling trendline, which runs close to resistance at $0.09587. Price needs to clear both before the upper levels open.
Can Dogecoin Push Toward Higher Resistance?
The bullish case starts with the price holding the $0.09128 support and bouncing. If buyers push DOGE through the falling trendline, the move can extend to $0.09587, about 2.9% above the current level.
A real breakout needs more than a brief touch. A 4H candle should close above both the trendline and $0.09587, and volume should be at least 1.5 times the average of the previous 20 candles.
A close on weaker volume would leave the move open to a fade. If that happens, the next stop is $0.09937, roughly 6.7% higher. A further push could then aim for $0.10396, a gain near 11.6%.
Whale buying, if confirmed by on-chain data, could support this path. Until then, the claim stays a headline.
What Happens If Dogecoin Gets Rejected?
The weaker path begins with a rejection at the falling trendline. If the price turns down from there, it would slide back toward the $0.09128 support, about 2.0% below the current level.
That floor has been tested several times in the past two weeks, so it is the line to watch. A 4H close below it on the same 1.5x volume threshold would confirm a breakdown.
The next support levels are $0.08825 and $0.08517. The last one is about 8.6% under the current price.
The soft RSI reading gives this setup a cautious lean until a trendline break proves otherwise.
Price Levels to Watch
Support | Resistance |
$0.09128 | $0.09587 |
$0.08825 | $0.09937 |
$0.08517 | $0.10396 |
Bull, Base, and Bear Scenarios
Scenario | Setup | Level |
Bull | Bounce from support, 4H close above the trendline and resistance with rising volume | $0.09587, then $0.09937 and $0.10396 |
Base | Price stays inside the triangle below the trendline. | $0.09128 - $0.09587 |
Bear | Rejection at the trendline, then 4H close below support with rising volume | $0.09128, then $0.08825 and $0.08517 |
Dogecoin vs Bitcoin
$DOGE usually tracks the direction of Bitcoin, but with bigger swings. A rally in BTC tends to lift it further, and a pullback tends to hit it harder.
Over the last 24 hours, DOGE slipped 3.2% in dollar terms and 1.0% against Bitcoin. That gap implies Bitcoin also fell, by roughly 2.2%, so $DOGE lagged a falling market instead of leading it.
Any bounce toward the trendline will likely need a steady Bitcoin. A deeper BTC pullback would add weight to the bearish case above.
Methodology
This Dogecoin price forecast relies on three sources. Price levels, the falling trendline, and RSI come from the Binance DOGEUSDT 4H chart on TradingView.
Market data comes from CoinGecko, and the news items come from public X posts.
Every level is tied to 4H candles, so a signal counts only after a full candle close. Percentage moves in this Dogecoin price prediction are measured from the chart price of $0.09315.
We treat unverified claims, including the whale-buying post, as headlines and not as inputs to any scenario.
Expert Opinion
Market commentary on short-term meme coin charts often makes one point: a triangle resolves with a candle close, not a wick.
Many chart watchers wait for that close, together with volume, before treating a break as real.
One view on the Kalshi listing is that the choice of DOGE hints at where US retail flow sits. That is an opinion, not data, and it still needs to show up in volume.
For now, the price remains below the falling trendline.
Disclaimer: This article is for information only and is not financial advice. Crypto prices are volatile, and the whale-buying figure comes from an unverified social post. DOGE can fall below every support level named here, and a failed breakout can reverse quickly. No scenario is guaranteed, and readers should research independently and invest only what they can afford to lose.







.webp)








