Chainlink Price Prediction: LINK Eyes $30.937 After Staking News?


Chainlink price prediction is the search of the day, and the daily chart is quietly building toward a moment traders will not want to miss.
A fresh staking report, a busy derivatives market, and a price glued to a key spot have all arrived together. Is the token about to make its real move, or is another stumble coming first? Here is the full read.
Editorial note: our desk holds no personal position in LINK; this is purely a chart and data read.
Chainlink Price Today: Live LINK Market Cap and Open Interest
At the time of writing (Oct 3, 2026, around 10:52 AM IST), the current market price (CMP) on the Binance 1D chart is 14.003.
Market cap is $10.45B, open interest (the total value of open futures contracts) is $733.89M, 24h futures volume is $700.90M, and spot volume is $149.95M. Circulating supply is 748.09M against a total and max supply of 1.00B.
Source: CoinGlass and TradingView, Oct 3, 2026, 10:52 AM IST
Chainlink News Today: Reported Staking v0.2 Pool Capped at 45M LINK
A BSCN (@BSCNews) X post from about 7 hours earlier says Chainlink staking v0.2 caps its pool at 45M LINK: 40.875M for community stakers (up to 15,000 each) and the rest for node operators (up to 75,000 each). 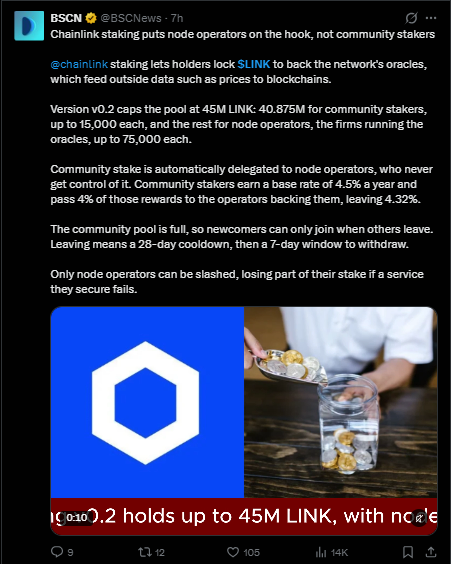
It adds that community stakers earn 4.5% a year and pass 4% of those rewards to the node operators and keep 4.32%, that the community pool is full, and that exits carry a 28-day cooldown plus a 7-day withdrawal window.
Only node operators can be slashed. This is an unverified report from a news outlet, not an official post. If accurate, newcomers can only join as others leave.
Source: BSCN (@BSCNews) on X, about 7 hours before Oct 3, 2026, 10:52 AM IST
LINK Price Forecast: Key Takeaways, Targets, and Support Levels
CMP is 14.003 on the 1D chart, sitting on the ascending trendline.
A daily close above 15.780 confirms the breakout and opens 21.500, then 30.937.
A daily close below 12.041 opens 10.630.
RSI divergence reads 58.49, with bearish labels near the Sep 4 and late-September highs.
The staking report is unverified, and open interest sits at $733.89M.
LINK Technical Analysis: Ascending Trendline Setup on the 1D Chart
Methodology: 1D Binance chart, RSI divergence indicator, ascending trendline, and swing highs and lows. Invalidation: a daily close below 12.041.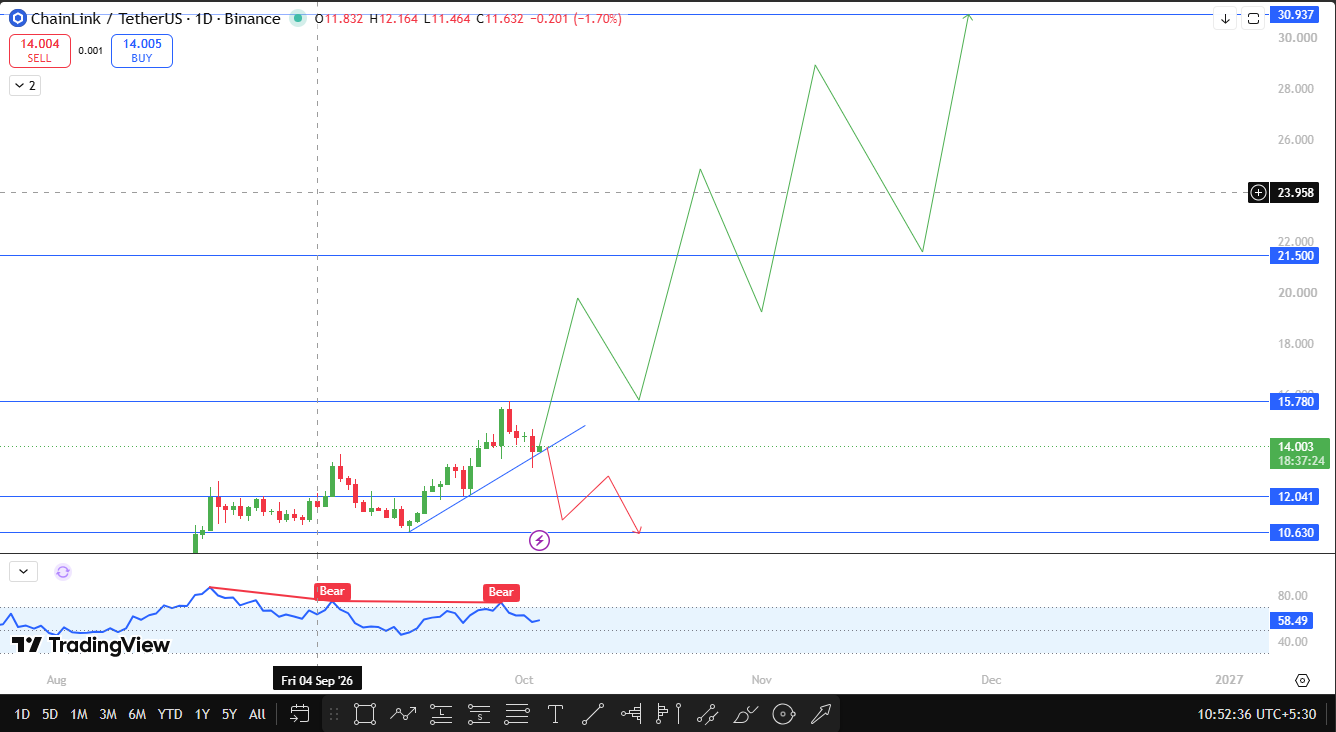
LINK has been climbing off an ascending trendline. The first retest produced a new higher high, and the price is now retesting the line for a second time while showing rejection. At 14.003 it sits right on the trendline, so the next daily closes matter.
The RSI divergence indicator reads 58.49. Two bearish divergence labels sit near the Sep 4 swing high and the late-September high, where price made a higher high that the RSI divergence indicator did not confirm.
A daily close above 15.780 would confirm the breakout. Every marked level, 15.780, 21.500, 30.937, 12.041, and 10.630, is an old swing high or low, so this read rests only on prior price action.
Chainlink Support and Resistance Levels: Major Breakout Zones
Level | Type | Importance | Distance From CMP |
30.937 | Resistance, old swing high | Final upside target | +120.93% |
21.500 | Resistance, old swing high | Second target | +53.54% |
15.780 | Resistance, breakout trigger | Key confirmation level | +12.69% |
14.003 | CMP | Reference price | 0.00% |
12.041 | Support, old swing low | Invalidation level | -14.01% |
10.630 | Support, old swing low | Next downside target | -24.09% |
Price Outlook: Bullish, Base, and Bearish Scenarios for Chainlink
Bullish Scenario
Confirmation is a daily close above 15.780. Targets are 21.500, then 30.937. It gets stronger if the price holds above 15.780 after the close and weaker if it slips back under it. Invalidation is a daily close below 12.041.
Base Scenario
Price keeps working around the trendline between 12.041 and 15.780, and the recent structure stays in a range until a daily close lands beyond either edge.
Bearish Scenario
Confirmation is a daily close below 12.041. The target is 10.630. It gets stronger if the rejection on this second retest deepens into lower closes and weaker if the price reclaims 12.041 on a daily close.
Crypto Market Context: Trend Analysis and Open Interest Read
Open interest equals about 7.0% of the $10.45B market cap, and the futures volume of $700.90M is about 4.7 times the spot volume of $149.95M. Derivatives lead spot trading here, which can speed up moves around 15.780 and 12.041.
Price Target Risks: What Could Invalidate This Breakout Setup
The second retest is already showing rejection, so the trendline can still give way. Leveraged positions can cause sharp daily wicks. The staking report is unverified, and the bearish RSI divergence labels near recent highs remain on the chart.
Price Prediction Conclusion: Major Chainlink Levels to Watch
The token trades at 14.003, right on the ascending trendline. A daily close above 15.780 points to 21.500 and 30.937, and a daily close below 12.041 points to 10.630. Until one of those closes arrives, treat the breakout as unconfirmed.
Disclaimer: Chainlink Price Prediction Is Not Financial Advice
This article is for informational purposes only and is not financial, investment, or trading advice. Crypto assets are highly volatile, so do your own research and manage risk before trading.







.webp)








