Dogecoin Price Prediction: Analyst Sees a Rare Zone, Chart Says?


Dogecoin derivatives hold $4.735 billion in open interest, more than six times the token's 24-hour trading volume. That gap shapes this Dogecoin price prediction October 2026, because leveraged bets can move a $14.6 billion market quickly.
The Dogecoin coin launched in 2013 as a light-hearted take on crypto, using the Shiba Inu meme as its face. It has since grown into one of the largest meme coins by market cap.
The Dogecoin price today is $0.09391, up 1.2% in the last 24 hours, with a market cap of about $14.662 billion.
That ranks Dogecoin #12 among all cryptocurrencies. And this Dogecoin Price Prediction reviews market data, news, and the outlook for October.
Live DOGE Market Data
Metric | Value |
Price | $0.09391 |
24H Change | +1.2% |
24H Range | $0.09265 - $0.09632 |
Market Cap | $14.662B |
Fully Diluted Valuation | $16.137B |
Source: market data taken from CoinGecko, as of Sep 30, 2026. Figures may vary slightly across other tracking websites.
Circulating supply is 156.126B $DOGE out of a total supply of 171.838B, so about 91% of the total is already in the market.
The token has no maximum supply, which means new coins can keep entering circulation over time.
Perpetual futures open interest matters most when price nears a key level. Large leveraged positions can add force to a move in either direction.
The snapshot also lists about 802 million DOGE in treasury holdings, roughly 0.5% of circulating supply.
Dogecoin News Today: Analyst Flags a Long-Term Accumulation Zone
The latest Dogecoin news today comes from a monthly-chart post by an analyst on X.
The post says Dogecoin has reached its best accumulation zone. It adds that the token visits this area once every few years and is still inside it.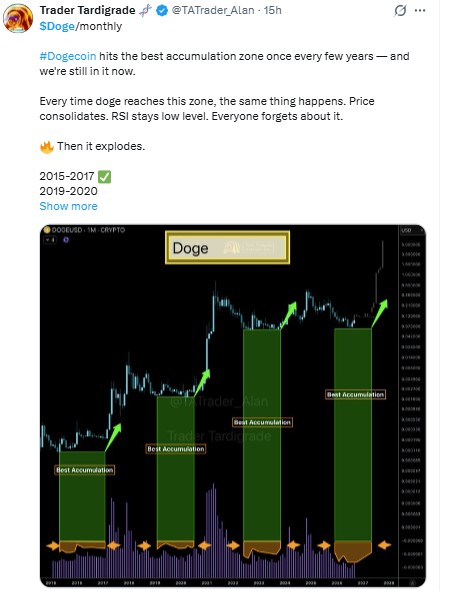
Source: Data taken from @TATrader_Alan post on X, as of Sep 30, 2026
According to the post, the price consolidated, and the RSI stayed low during earlier visits, and a rally followed. It lists 2015 to 2017 and 2019 to 2020 as examples.
The attached chart marks four such zones, with the latest one still open.
This is one analyst's reading of a monthly chart. Past cycles do not guarantee a repeat, and the post says nothing about the next few days. The hourly setup below covers the short term.
Dogecoin Technical Analysis
This Dogecoin technical analysis uses the 1-hour DOGEUSDT chart from Binance, viewed on Sep 30, 2026, at 11:15 IST (UTC+5:30).
In this timeframe, DOGE is moving inside an ascending channel. The lower boundary runs up from the September 28 low near $0.0915, and the upper boundary runs parallel above it. 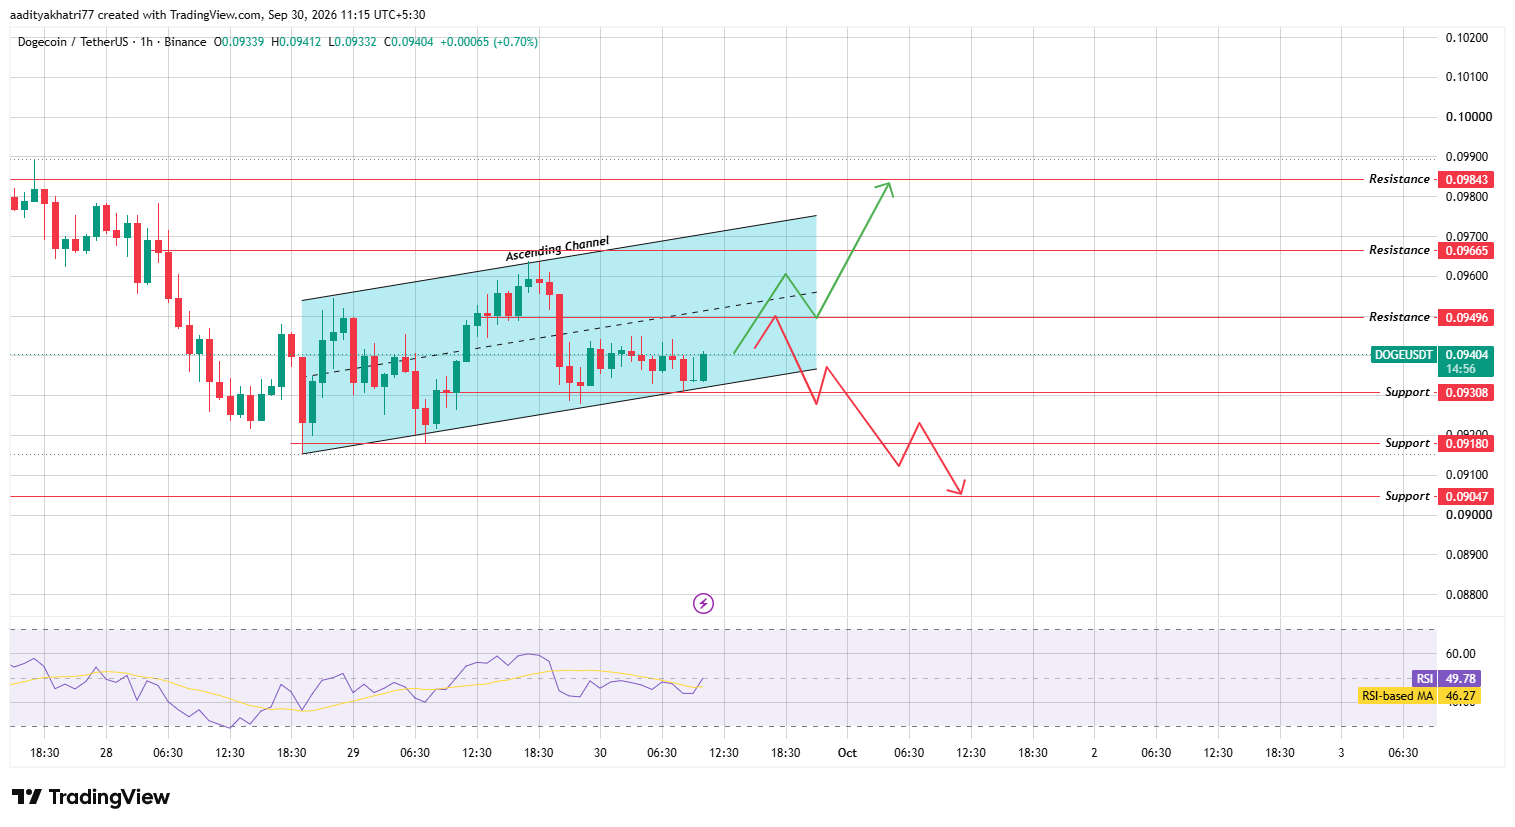
Source: Chart taken from TradingView, Binance DOGEUSDT 1-hour chart, as of Sep 30, 2026, 11:15 IST
At the time of the chart, the lower boundary sat near $0.0932 and the upper boundary near $0.0971.
Price has bounced off the lower boundary several times since September 28. The latest 1-hour candle trades at $0.09404, below the channel midline, above the $0.09308 support and below the $0.09496 resistance.
RSI reads 49.78 and sits above its moving average of 46.27. It is just under the 50 midline, so momentum is neutral with a slight lean toward recovery.
Can DOGE Break The Upper Boundary?
The bullish case starts with a hold above the $0.09308 support and the lower boundary near $0.0932.
If buyers defend that zone, the price can push up to the $0.09496 resistance, which sits close to the channel midline.
A 1-hour candle close above $0.09496 would be the first confirmation. Volume should also exceed the average of the previous 20 candles.
The next hurdle is $0.09665, which sits just below the upper boundary near $0.0971.
A close above the upper boundary would then open the way to $0.09843. The green path on the chart shows a pullback toward $0.09496 after the first push, which is common after a level break. A break without volume can fail and drop back into the channel.
What Happens If DOGE Breaks The Lower Boundary?
The bearish case starts with rejection at $0.09496. The red path on the chart shows price failing there and falling back to the lower boundary near $0.0932.
A 1-hour close below $0.09308 would confirm a break of both the channel and the support. The first target is $0.09180, and the next is $0.09047.
The chart shows a weak bounce between those levels before the last leg lower.
Dogecoin Price Levels to Watch
These Dogecoin price levels come from the zones marked on the 1-hour chart.
Support | Resistance |
$0.09308 | $0.09496 |
$0.09180 | $0.09665 |
$0.09047 | $0.09843 |
Dogecoin Price Prediction: Bull, Base, and Bear Scenarios
Scenario | Setup | Level |
Bull | 1-hour close above $0.09496, then the upper boundary breaks | $0.09665 to $0.09843 |
Base | Range trade inside the channel | $0.09308 to $0.09496 |
Bear | 1-hour close below $0.09308, lower boundary breaks | $0.09180 to $0.09047 |
Dogecoin vs Bitcoin
Bitcoin usually sets the tone for large altcoins such as Dogecoin. A steady Bitcoin market gives a channel breakout room to hold. A sharp Bitcoin drop can push DOGE through support no matter what its own chart shows.
The market data shows DOGE up about 0.9% against Bitcoin over the past 24 hours. That means it is close to matching the market leader.
Methodology
This Dogecoin price prediction 2026 update uses the 1-hour DOGEUSDT chart from Binance on TradingView.
The channel boundaries, RSI, and the RSI-based moving average were read candle by candle. The boundary values quoted in the text are approximate readings from the chart.
Support and resistance levels come directly from the zones marked on that chart. Price, market cap, volume, open interest, and supply figures come from a CoinGecko snapshot.
The analyst post comes from an X screenshot, dated Sep 30, 2026, and it was not used to set any hourly level.
Nothing here replaces independent research. A chart pattern describes probability, not certainty, and a 1-hour setup can change within a few candles.
Expert Opinion
Taken together, the hourly chart supports a neutral Dogecoin price forecast for October while DOGE trades inside the channel. Price sits below the channel midline, and the RSI is close to 50.
The long-term accumulation view adds context but not timing. A confirmed 1-hour close above $0.09496 would favor buyers, while a close below $0.09308 would favor sellers. This is general market commentary, not a guarantee of direction.
Disclaimer: This article is for informational purposes only and does not constitute financial advice. Cryptocurrency markets, including Dogecoin, carry high volatility and downside risk; prices can move sharply against any projected level, and past performance offers no guarantee of future results. Readers should conduct independent research before making any investment decision.










.webp)











