Dogecoin Price Prediction: Futures Selling Hits DOGE! $0.055 in Focus


Dogecoin trades at $0.05697 after a 2.15% daily drop, and a trader post says futures selling is driving the market lower.
This Dogecoin Price Prediction checks that claim against liquidation data and the daily chart. A daily close above $0.06049 would be the first sign of recovery.
Market data checked on November 20, 2026, at 10:52 IST.
Why is the Dogecoin price down today?
Dogecoin price today is down 2.15% to $0.05697 in 24h, broadly tracking Bitcoin’s 3.14% decline as crypto markets sell off; no clear Dogecoin-specific catalyst was visible. The move is primarily driven by broader market weakness amid rate hike concerns and ETF outflows.
Primary reason: Market-wide selling, with DOGE moving in line with Bitcoin as tighter rate expectations and weak ETF demand weigh on crypto.
DOGE Liquidation Data: Longs Took About 95% of the Losses
A liquidation is a forced close of a leveraged trade when the trader can no longer cover losses. Longs bet on a rise, and shorts bet on a fall.
Window | Total Liquidated | Long | Short |
1h | $259.46K | $258.71K | $750.22 |
4h | $1.12M | $1.09M | $20.47K |
12h | $1.99M | $1.89M | $104.73K |
24h | $2.58M | $2.44M | $140.50K |
Source: Data From CoinGlass
Longs were about 99.7% of the last hour, 97% of 4 hours, 95% of 12 hours and 95% of 24 hours. That fits a steady fall that forced out leveraged buyers, though it does not prove why price moved.
Dogecoin News: DOGE Futures Outflows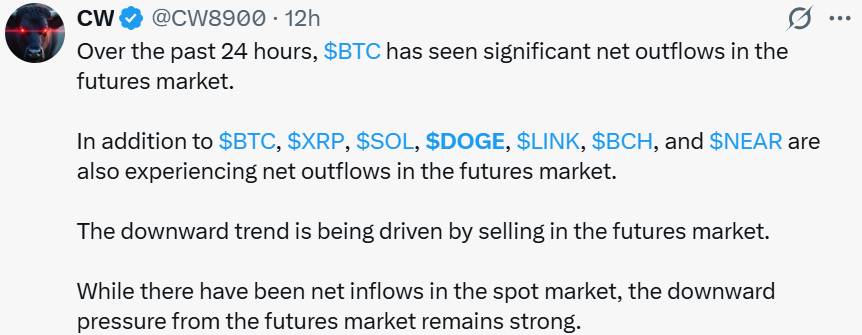
CW posted about 12 hours before publication that, over the past 24 hours, BTC saw significant net outflows in the futures market.
It adds that XRP, SOL, DOGE, LINK, BCH and NEAR also saw net outflows. The post says selling in futures is driving the downtrend, and that spot markets saw net inflows while futures pressure stays strong.
Futures are contracts that track a coin's price without owning it. The post gives no figures, exchange or data source, so CoinGabbar could not verify it.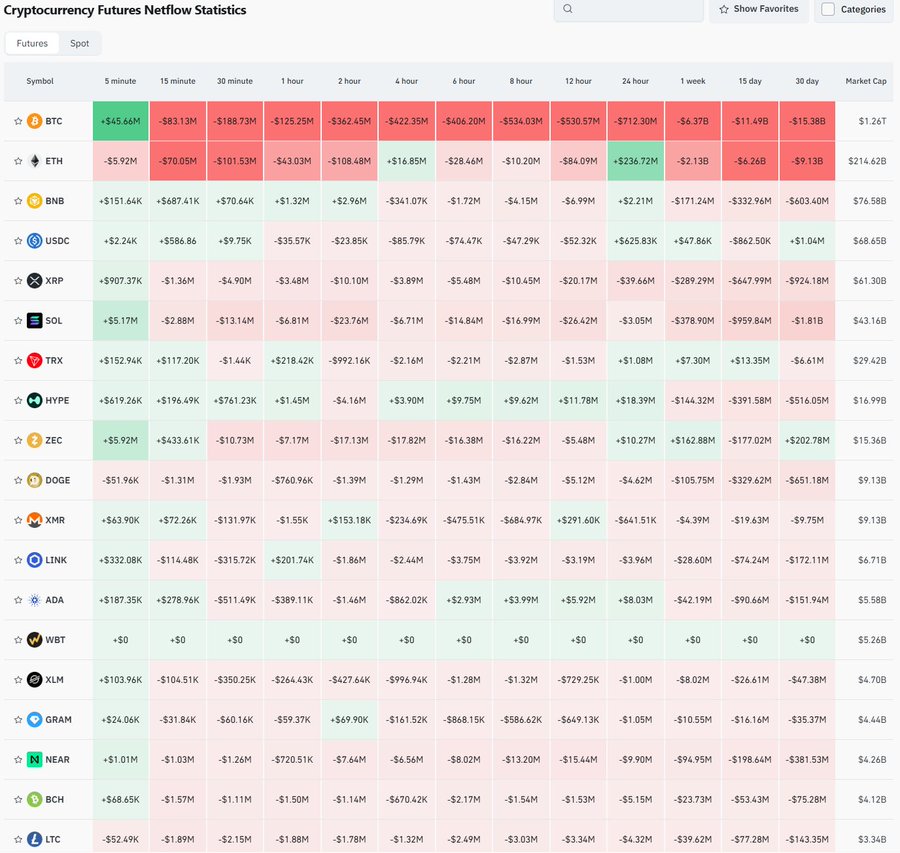
The long-heavy liquidations above fit its view of futures-led selling, but we have no spot data to test the inflow claim.
Source: Data From X
Dogecoin Price Prediction: Technical Analysis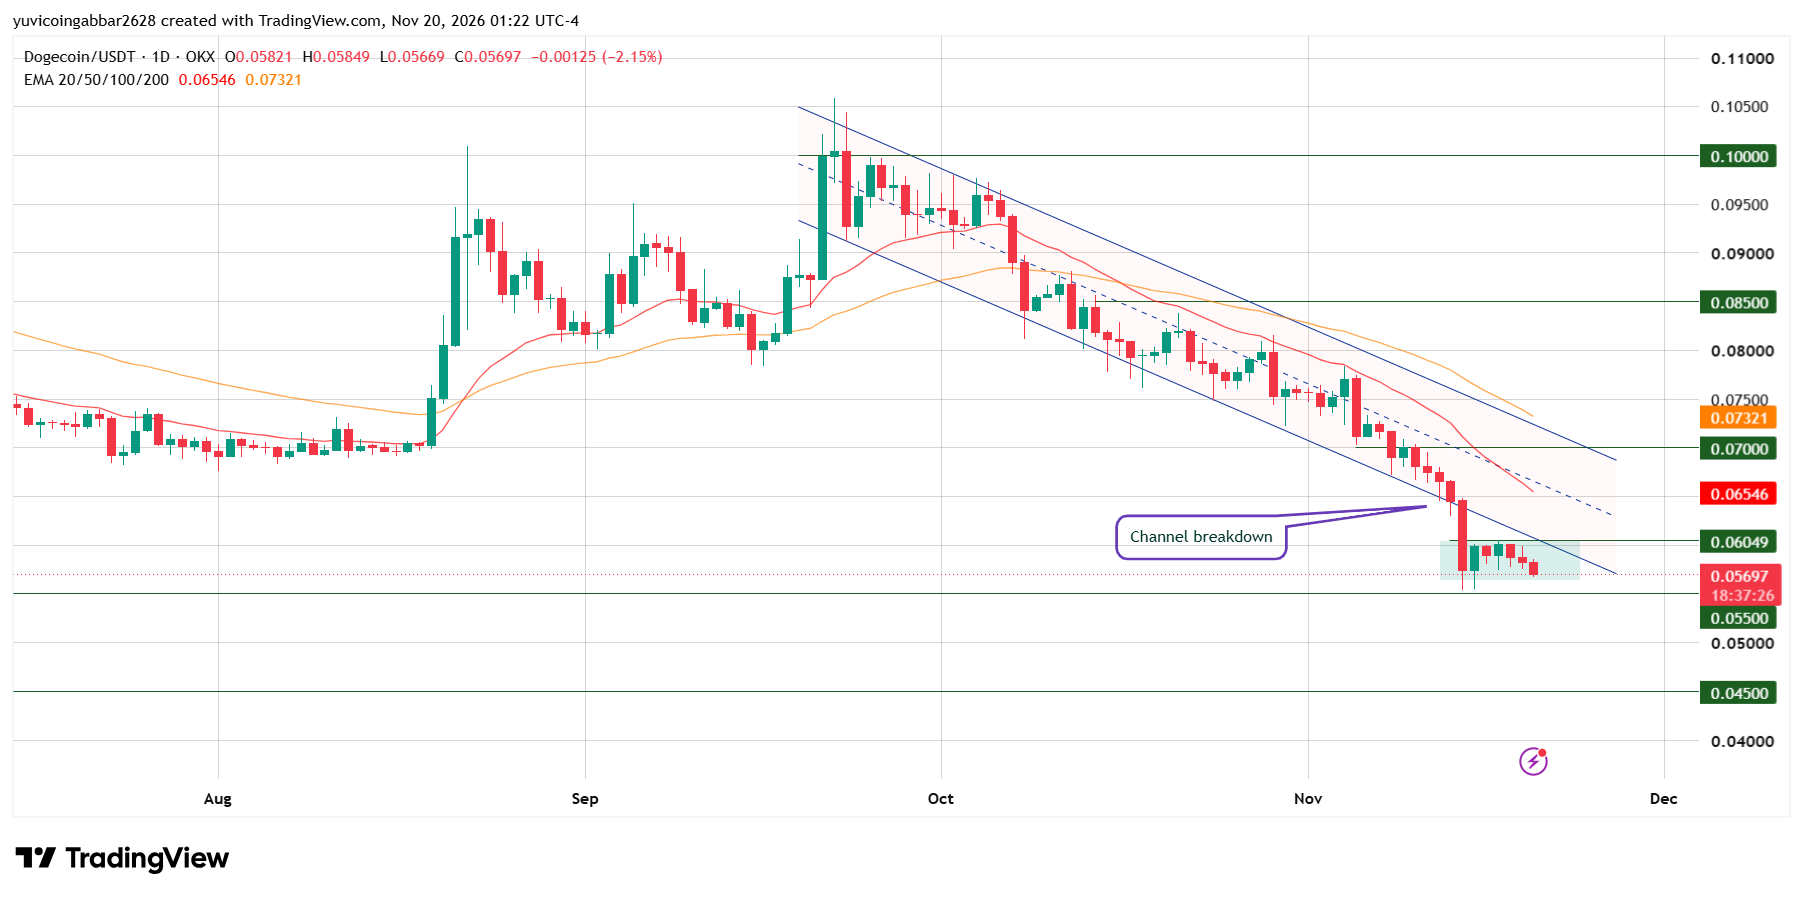
DOGE peaked near $0.105 in early September and has fallen inside a descending channel since. A channel is a pair of sloping lines that contain price.
The chart labels a "channel breakdown" on the long red candle that closed below the lower line around November 14.
Since then, $DOGE has moved sideways in a shaded box between $0.05500 and $0.06049. Today's red candle opened at $0.05821 and sits at $0.05697, in the lower half of that box.
EMA, or exponential moving average, averages recent closes and weights newer days more. These $DOGE moving averages sit above price, and EMA 20 $0.06546 is under EMA 50 $0.07321.
Dogecoin Price Prediction: $DOGE Key Support Levels
Type | Level |
Highest marked level | $0.10000 |
Upper resistance | $0.08500 |
Resistance zone | $0.07000 |
Initial recovery level | $0.06049 |
Immediate price reference | $0.05697 |
First confirmed support | $0.05500 |
Deeper support | $0.04500 |
Dogecoin Price Prediction Scenarios (November 20, 2026)
Bull scenario: For this DOGE price prediction, a daily close above $0.06049 would point to a move toward $0.07000. The setup fails if $DOGE closes back below $0.06049.
Base scenario: If $DOGE stays between $0.05500 and $0.06049, the price would likely keep moving sideways. A close beyond either level ends the range.
Bear scenario: A daily close below $0.05500 would open a slide toward $0.04500. The setup fails if $DOGE closes back above $0.05500.
What Happens If Dogecoin Breaks Support?
The $0.05500 level is only about 3.5% below price, so it matters most for the $DOGE short-term price outlook.
Any Dogecoin Price Forecast toward $0.10000, about 76% higher, needs $DOGE to clear $0.06049, $0.07000 and $0.08500 first. See our DOGE price history.
DOGE Price Prediction: CoinGabbar Technical Read
Trend and $DOGE market sentiment both lean down. A close above $0.06049 would be the first step, while a close below $0.05500 would keep sellers in control. See our latest crypto price predictions.
Disclaimer
This article is for informational purposes only and isn't financial advice. Crypto markets are volatile. Always do your own research before making any trading decisions involving DOGE.