Ethereum News Prediction: ETH ETFs Hit Worst Month as Whale Buys $63M


This Ethereum News Prediction looks at a mixed set of signals. The altcoin trades near $2,240, and U.S. ETF money is leaving fast. Yet one large whale just bought $62.97M worth of ETH.
Ether ETFs had their worst month since launch. Funding rates are deeply negative, and the Coinbase Premium sits near an 8-month low. Traders are split on what comes next.
Ethereum ETF Outflows Hit a Record in October
SoSoValue data shows outflows in all five weeks that ended in October. Adding the weekly figures gives roughly $1.65 billion leaving the funds. That tops the old record of $1.42 billion from November 2025.
The heaviest week ended October 9, with $542.07 million out. On October 30 alone, daily outflows were $155.85 million.
Week Ending | Weekly Net Flow |
Oct 2, 2026 | -$138.02M |
Oct 9, 2026 | -$542.07M |
Oct 16, 2026 | -$319.97M |
Oct 23, 2026 | -$220.61M |
Oct 30, 2026 | -$431.53M |
October total (sum) | about -$1.65B |
From July through September, the funds had drawn $3.05 billion. That run has now ended.
Total net assets fell to $13.22 billion from $17.60 billion during October. Cumulative net inflows slipped to $12.29 billion.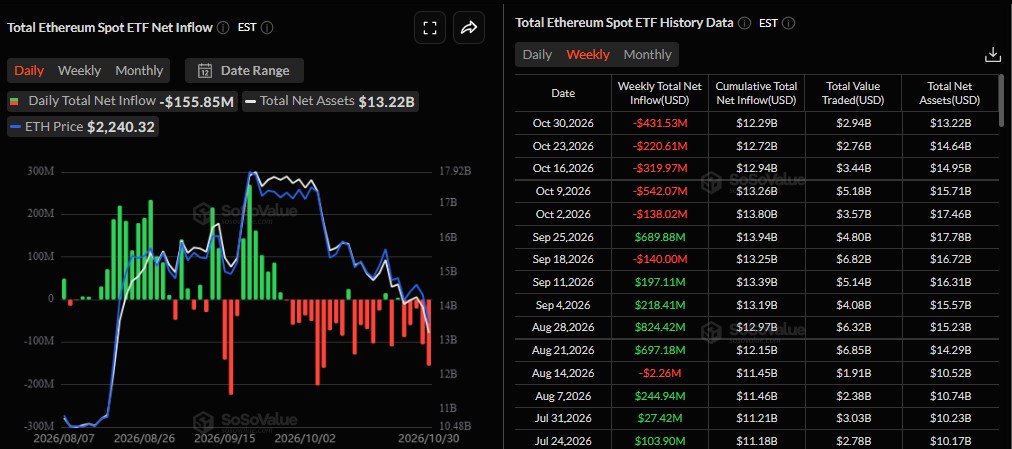
Whale Buys $63M of ETH Near $2,286
Lookonchain reported that a whale spent $62.97M over five hours. It bought 27,553 $ETH at an average price of $2,286.
Arkham data in the post shows stablecoin swaps for ETH through Uniswap, with a market maker address involved.
The entry is close to the current price. So the buyer has little cushion if the altcoin slips.
ETH Funding Rate Drops to Lowest Since June
Analyst Ted says the ETH funding rate is at its lowest level since June's bottom. Many traders hold short bets and expect a big drop.
On Binance, price trades near $2,268. That is well below the September high close to $2,800.
Negative funding means shorts pay longs. When too many traders lean one way, a sharp move against them can follow. That is a risk for bears, but not a promise.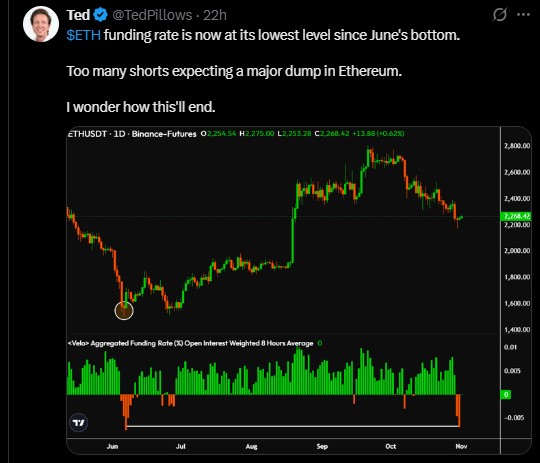
Coinbase Premium Index Falls to 8-Month Low
As per CryptoQuant, the index tracks the $ETH price gap between Coinbase and Binance. It dropped to about -0.21 on October 29, the lowest since last February.
A negative reading can point to weaker U.S. demand or more selling on Coinbase.
The index later bounced. Still, the chart label shows about -0.13, so it remains below zero. A move back above zero would hint at returning U.S. buyers.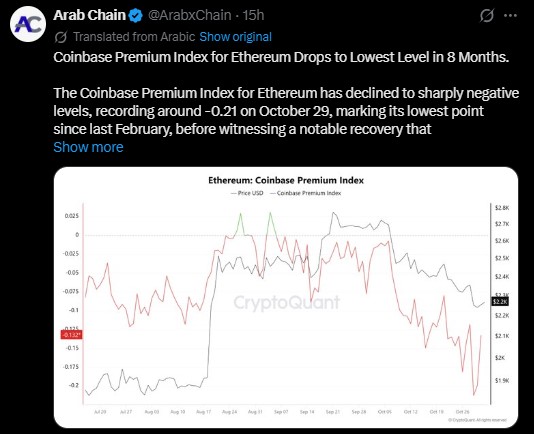
Ethereum Technical Outlook: Key Levels to Watch
One analyst sees an inverse head and shoulders pattern forming on the chart. The neckline sits near $3,000.
Level | Why It Matters |
$2,200 to $2,300 | Right shoulder zone to hold |
$2,800 to $3,000 | Neckline area to reclaim |
$3,400 | First breakout target |
$3,600 | Second breakout target |
A pattern is only a view. It weakens if the altcoin loses the right shoulder zone.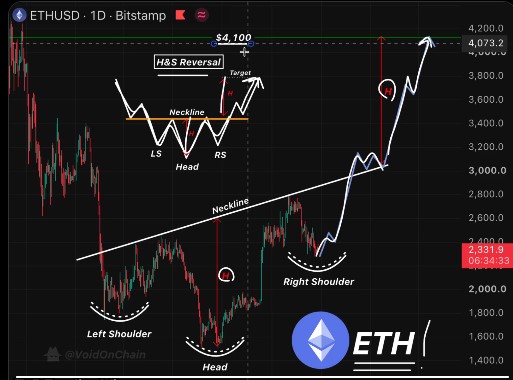
Ethereum News Prediction: What Comes Next for ETH?
The signals point in two directions. ETF outflows and the weak Coinbase Premium show soft U.S. demand.
Whale buying, deeply negative funding, and the possible chart pattern give bulls something to work with.
ETH may stay inside the $2,200 to $2,300 area if ETF flows stay weak. A drop under it would test the bullish idea. A move toward $2,800 to $3,000 would likely need steady inflows.
Nobody knows which path wins. ETF flows look like the first thing to watch.
Disclaimer
This article is for information only and is not financial advice. Crypto prices are volatile, and you can lose money. Do your own research and speak with a licensed advisor before you invest.