Ethereum Price Prediction: Can ETH Hold $2,700 as ETF Outflows Rise?


Ethereum is trading near $2,704.20 today, down 0.43% in the last 24 hours. The price has moved sideways for days and still sits under a key ceiling.
October is often called "Uptober," but the start looks bumpy. ETF money is leaving, and ETH has not cleared resistance yet.
What Is the ETH Price Today?
The altcoin trades at $2,704.20 with a market cap of $331.67 billion. Circulating supply is 122.11 million ETH.
Futures volume over 24 hours is $30.98 billion. Spot volume is much smaller at $1.99 billion. Most of the action is happening in derivatives.
Why Is Ethereum Price Not Going Up Today?
Part of the answer is fund flows. U.S. spot ETH ETFs have posted net outflows for four reported sessions in a row.
Date | Net ETF Flow |
Sept 30 | -$59.58 million |
Oct 1 | -$55.37 million |
Oct 2 | -$37.36 million |
Oct 5 | -$50.76 million |
That adds up to roughly $203 million, leaving four sessions. Institutions are not showing a clear return of demand yet.
Price also has not closed above the $2,780 to $2,800 area. Until that happens, buyers lack a strong push.
Is Ethereum Bullish or Bearish Right Now?
Activity is high, but the mood is mixed. Here is the snapshot.
Metric | Value |
Futures volume (24h) | $30.98B (+10.93%) |
Open interest | $34.12B (+0.16%) |
Options volume | $956.99M (-3.77%) |
Options open interest | $6.03B (-0.70%) |
Long/short ratio (24h) | 0.8643 |
Binance ETH/USDT accounts | 2.5423 |
OKX ETH accounts | 1.42 |
Binance top traders (accounts) | 1.4102 |
Binance top traders (positions) | 1.6368 |
The overall long/short ratio of 0.8643 leans slightly bearish. Yet the big exchanges show more longs than shorts, especially among top traders.
Liquidations tell a similar story. About $22.07 million was wiped out in 24 hours.
Period | Total Liquidated | Longs | Shorts |
1 hour | $2.81M | $2.54M | $268.09K |
4 hours | $5.89M | $3.97M | $1.92M |
12 hours | $9.27M | $5.63M | $3.64M |
24 hours | $22.07M | $14.63M | $7.44M |
Longs made up about two-thirds of the 24-hour total. Bulls have felt more pain lately.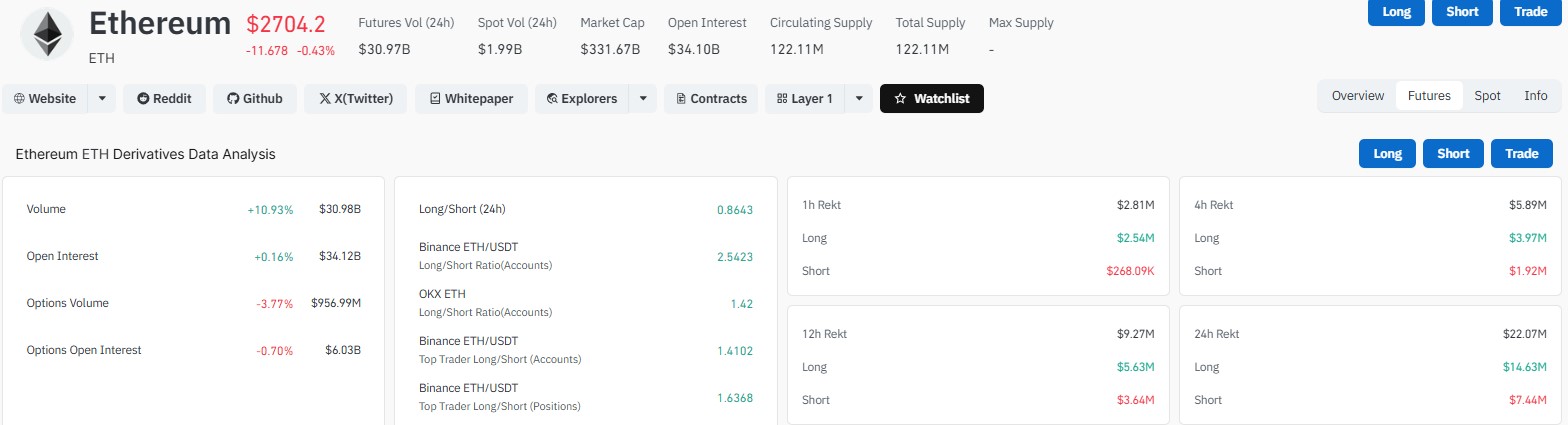
What Is the ETH Support and Resistance Level Today?
Analyst Ted shared a weekly chart and wrote that the altcoin has been grinding up for weeks while leaving the lows untouched. He thinks those lows will be retested before the next big move.
His chart marks resistance near $2,800, with the next zone far above near $3,447. First support sits around $2,550. Deeper levels show near $2,190 and $1,965.
Another view puts the first buyer zone at $2,600 to $2,635. That analyst wants a daily close above $2,800, then a hold, before calling $3,000 realistic.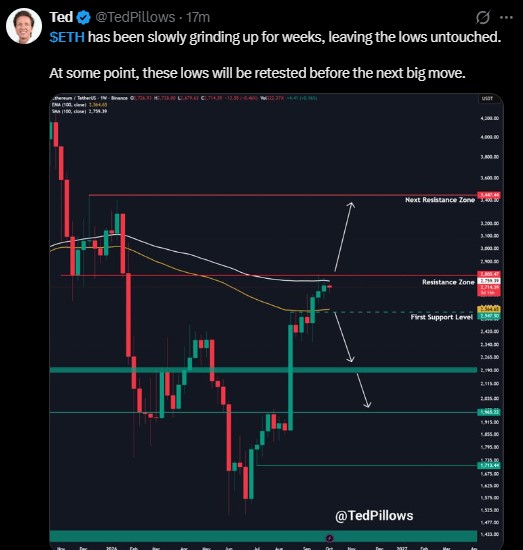
Level | Type | Note |
$3,000 | Psychological target | Needs a daily close above $2,800 first |
$2,807 | Major resistance | Top of the 4-hour range |
$2,725 to $2,750 | Near resistance | Falling triangle line |
$2,690 to $2,705 | Short-term pivot | Near the 20 and 50 EMA |
$2,600 to $2,635 | First support | Buyers expected to defend |
$2,480 to $2,520 | Next support | Comes into focus if $2,600 breaks |
Is Ethereum Forming a Triangle Pattern on the 4-Hour Chart?
Yes. The 4-hour chart shows a symmetrical triangle. Lower highs press down from above, while higher lows push up from below.
Price is at 2,705. It's just above the 20EMA (2,704), 50 EMA (2,695), and 100EMA (2,667). The 200 EMA is lower at $2,581.74.
RSI is near 51 to 54. That is neutral with a mild bullish tilt.
The tight squeeze suggests a bigger move may be near. The direction is the open question.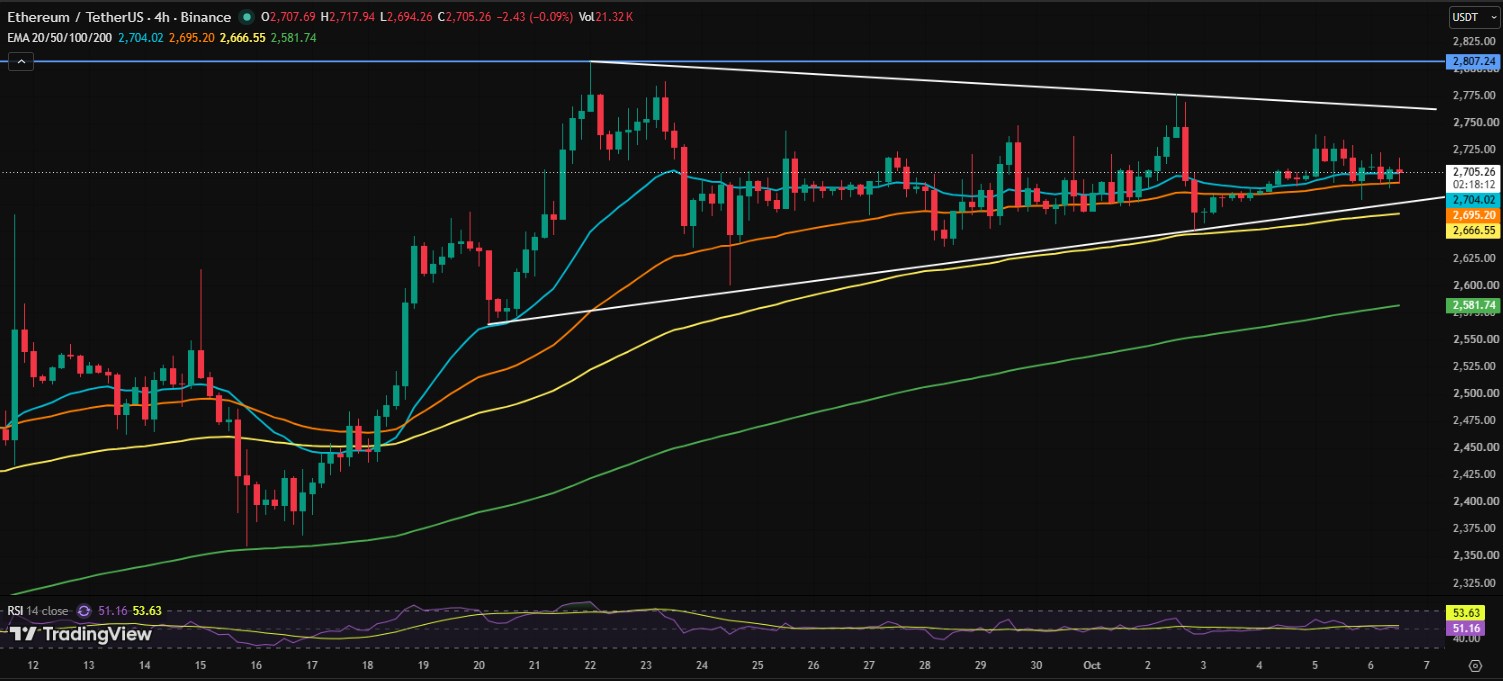
ETH Price Prediction: Bull and Bear Scenarios
Bullish case: A 4-hour close above $2,750 would strengthen the view. That could open a path toward $2,775 to $2,810, where $2,807 is the big test.
A daily close above $2,800 that holds would put $3,000 back on the table.
Bearish case: A drop below $2,690 would weaken the structure. ETH could slide to $2,665, then $2,620 to $2,600.
Losing $2,600 would bring the $2,480 to $2,520 range into play. A deeper retest of the weekly lows, as Ted described, is also possible.
None of this is certain. Wicks through a level are not the same as a confirmed close.
What Is the Glamsterdam Upgrade and Does It Affect ETH Price?
Today, October 6, the Glamsterdam upgrade is set to activate on the Sepolia test network. It includes enshrined proposer-builder separation, block-level access lists, and gas-pricing changes.
The goal is to prepare the network for higher Layer 1 throughput. The Ethereum Foundation says this applies only to Sepolia. Dates for Hoodi and mainnet are not set.
Headlines around the upgrade may add noise to price in the short term.
Will Ethereum Price Go Up in October 2026?
Seasonality favors October, but it is no promise. ETF outflows, unbroken resistance, and a network event could cause sharp false moves both ways.
The triangle should resolve soon. Watch the $2,750 and $2,690 edges on the 4-hour chart, and $2,800 on the daily.
If ETH holds above $2,600 and clears $2,800 with a strong close, bulls get the upper hand. If not, a retest of lower support looks likely.
Disclaimer
This article is for information only and is not financial, investment or trading advice. Crypto prices are volatile, and you can lose some or all of your money. Price targets are possibilities, not guarantees. Always do your own research and speak to a licensed financial advisor before making any decision.











.webp)





