Filecoin Price Prediction: Can Buyers Stop a Drop Below $0.5628?


Can buyers hold $0.5628 level, or will sellers push FIL toward $0.4607 support level?
This Filecoin price prediction begins with FIL trading under its broken October range, a band held between a support level and a resistance level. Readers tracking long-term FIL targets need the short-term levels to hold first. Buyers have stepped in at support levels before, and sellers have capped rallies at resistance levels.
Filecoin Price Forecast: 24-Hour Market Snapshot
FIL ranks 97th by market cap in CoinGecko market data, and the token is down 3.9% on the day.
Metric | Value |
Price | $0.5957 |
24h change | -3.9% |
24h range | $0.5908 to $0.6245 |
Market cap | $504.327M |
Market cap rank | 97th |
FDV | $1.166B |
24h volume | $62.97M |
Circulating supply | 846.575M FIL |
Source: CoinGecko FIL market snapshot, captured Nov 16, 2026, 10:50 UTC
fully diluted valuation, prices every token in total supply at today's rate. At $1.166B, it sits well above the $504.327M market cap.
That gap matters for this Filecoin price prediction, because supply outside circulation can add sell pressure if it reaches the market.
FIL Price Forecast Risk: Top 10 Wallets Hold 57.26%
The ten largest addresses on Filscan's rich list hold 57.26% of the supply it tracks. The largest address alone holds 282,933,381.04 FIL, or 22.31%.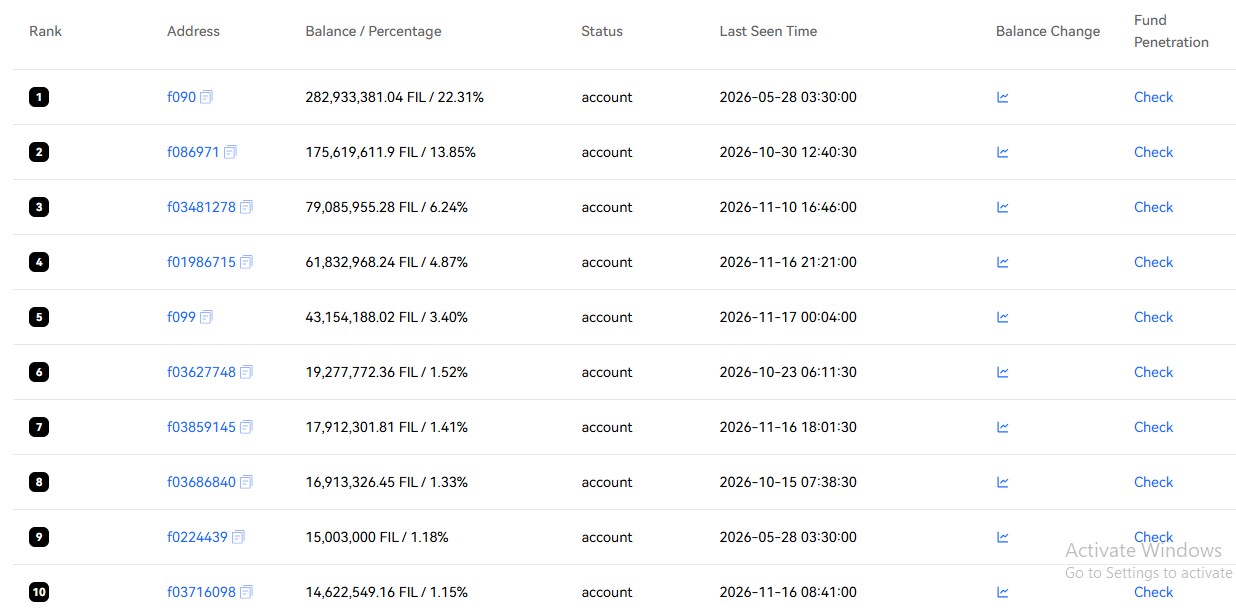
Source: Filscan $FIL top 10 address list, captured Nov 16, 2026, 10:50 UTC
The second address holds 175,619,611.9 $FIL, or 13.85%. Filscan tags all ten as accounts, and none carries an exchange label.
A top-heavy list adds volatility risk to this Filecoin price prediction, since one large transfer can move order books fast.
FIL Liquidation Data: $818.54K Wiped in 24 Hours
A liquidation happens when an exchange forcibly shuts a leveraged trade because the trader's margin runs out. CoinGlass logs the liquidation data on its FIL futures page, and the 24h total reached $818.54K.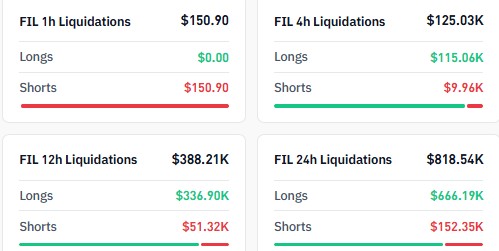
Source: CoinGlass $FIL liquidations, captured Nov 16, 2026, 10:50 UTC
Longs took the hit. They lost $666.19K, or 81.4% of the 24-hour total, while shorts lost $152.35K.
Over the last 12h, longs lost $336.90K against $51.32K for shorts. And the last hour flipped, with $150.90 in short liquidations and no long losses.
Long liquidations add forced sell orders, which can push the price lower. The empty long column in the last hour points to forced selling easing for now.
FIL Open Interest: $116.49M Volume on Futures
Open interest is the total value of futures contracts still open and not yet settled. CoinGlass counts $116.49M across exchanges, while 24h futures volume totals $139.63M.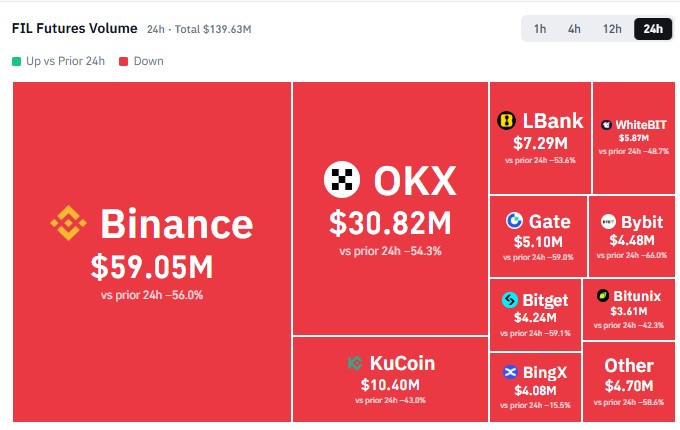
Source: CoinGlass $FIL futures volume, captured Nov 16, 2026, 10:50 UTC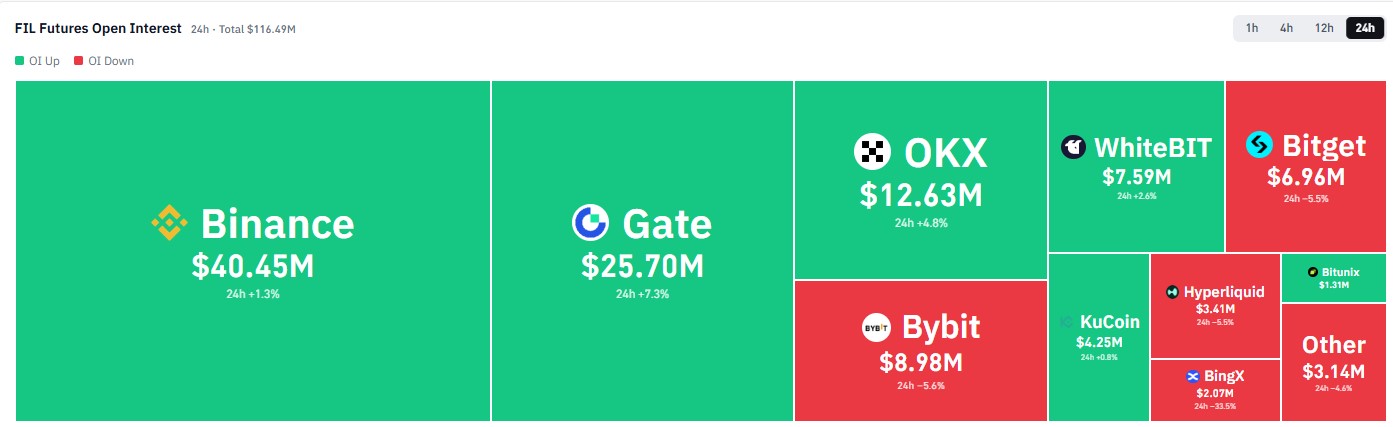
Source: CoinGlass $FIL futures open interest, captured Nov 16, 2026, 10:50 UTC
Open interest rose on Binance, Gate, OKX, WhiteBIT, and KuCoin while the price slid 3.9%. Rising open interest during a drop means traders are adding positions.
Futures volume fell on every exchange versus the prior 24h, with BingX at -15.5% and Bybit at -66.0%. Positioning could flip when crypto news updates hit the market. Fewer trades on a drop show less conviction behind the selling.
Filecoin Technical Analysis: 1 Day Timeframe
The Binance daily chart for $FIL/USDT on TradingView frames this Filecoin price prediction. A October rally pushed FIL up to the $1.2222 resistance level before sellers took control.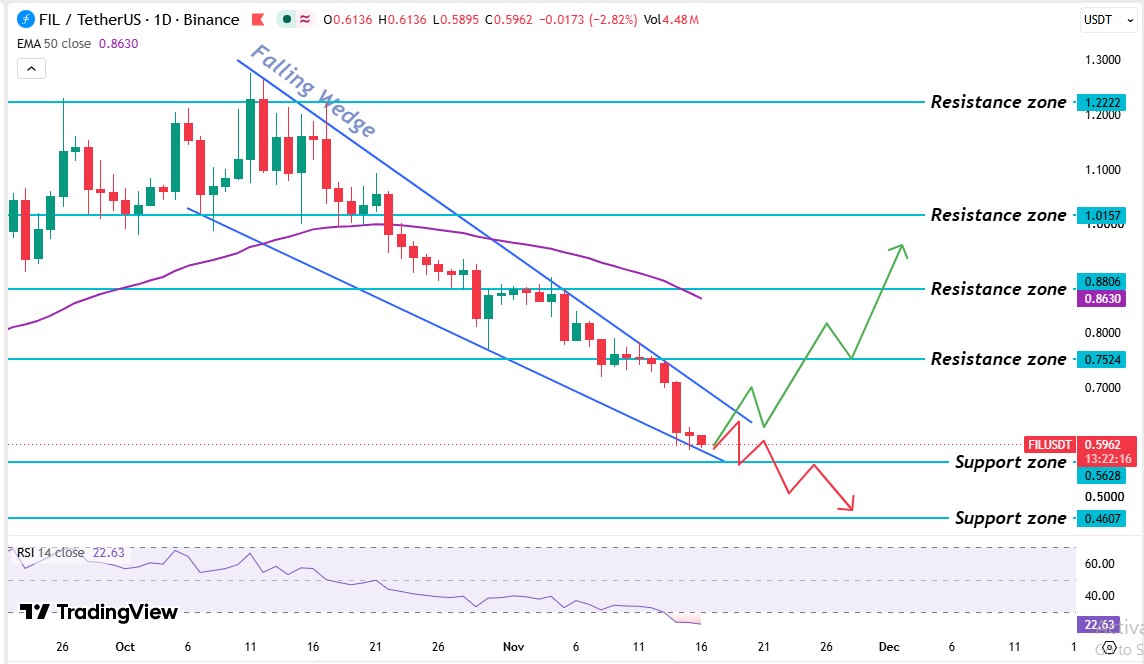
Source: TradingView, $FIL/USDT 1D chart with EMA 50 and RSI 14, captured Nov 16, 2026, 10:50 UTC
Before the rally, the price moved sideways in a range. After the peak, $FIL printed lower highs inside a falling wedge, a narrowing channel sloping down. In the second half of October, the price broke below the 50-day EMA and slid toward the $0.7524 level.
Buyers then tried to break the $0.8806 resistance level several times in early November and failed. Price slipped back and traded around $0.7524. for several days. Any case for FIL reclaiming $1 starts with that level. It had held as support, so once it broke in mid-November, it flipped into a resistance level that now caps bounces.
Right now, the price trades 5.5% above the $0.5628 support level and below every resistance level and the 50-day EMA. A break above the wedge's upper line points to a bounce, while a break below its lower line extends the drop.
The $FIL 50-day EMA sits at $0.8630. FIL's $0.5957 price trades 31.0% below it, and the latest daily candle trades below the EMA too. The $0.8806 resistance level sits right next to it, so a real recovery needs a daily candle trading above both.
The $FIL RSI reads 22.63 on the 14-day setting, down from an earlier peak near 70. Under 50 means sellers hold the edge. Readings under 30 mark oversold conditions, meaning selling has gone too far and a bounce is possible. Actually, oversold readings can persist, so RSI alone doesn't confirm a turn.
$FIL Support Levels and Resistance Levels: Six Prices to Watch
Level | Type |
$1.2222 | Resistance level |
$1.0157 | Resistance level |
$0.8806 | Resistance level |
$0.8630 | 50-day EMA |
$0.7524 | Resistance level |
$0.5628 | Support level |
$0.4607 | Support level |
Support levels sit where buyers step in, and resistance levels sit where sellers do. The nearest pair is $0.5628 below and $0.7524 above.
Filecoin Price Forecast: Bull, Base, and Bear Scenarios
Scenario | Trigger | Target | Invalidation |
Bull | Daily candle trades above $0.7524 | $0.8806, then $1.0157 | Falls back below $0.7524 |
Base | Price stays between $0.5628 and $0.7524. | Sideways trade inside that range | Daily candle breaks either level. |
Bear | Daily candle trades below $0.5628 | $0.4607 | Daily candle trades above $0.7524 |
Regulatory delay is the main outside risk, since a stalled headline can cool demand fast. A daily candle trading above $0.7524 ends the bear case, and one trading below $0.5628 confirms it.
Expert Outlook: Filecoin Price Prediction
According to CoinGabbar analysis, this Filecoin price prediction leans bearish. Longs made up 81.4% of the 24h liquidations, and price trades 31.0% below the 50-day EMA.
If the next daily candle trades below $0.5628, the falling wedge breaks to the downside and sellers confirm control. A hold above it keeps the base range alive.
Disclaimer: This article is for information only and isn't financial advice. Traders should do their own research and risk only what they can afford to lose.