Gold Price Prediction: $4,100 Battle! Can Gold Reclaim $4,400 Next?


Gold is facing an important technical test after a sharp pullback on the 4-hour chart. This Gold Price Prediction looks at whether buyers can defend the key $4,100 support and push XAU/USD back toward higher resistance levels.
Gold price is closed at $4,139, up 0.02%, with buyers defending the $4,100 support zone. However, the price remains below the 200 EMA at $4,300.52, keeping the short-term structure under pressure.
Gold Price Today: Key Levels to Watch
| Level | Type | What It Means |
| $4,400 | Resistance | Major upside target |
| $4,300 | 200 EMA | Key trend-reclaim level |
| $4,184 | Resistance | Nearby resistance |
| $4,139.14 | Current Price | Latest chart price |
| $4,100 | Support | Key downside level |
| $4,000 | Major Support | Deeper psychological support |
The $4,100.36 level is the most important support on the current 4-hour setup. Holding this area could allow buyers to attempt a recovery, while a confirmed close below it would weaken the structure further.
Gold Price Technical Analysis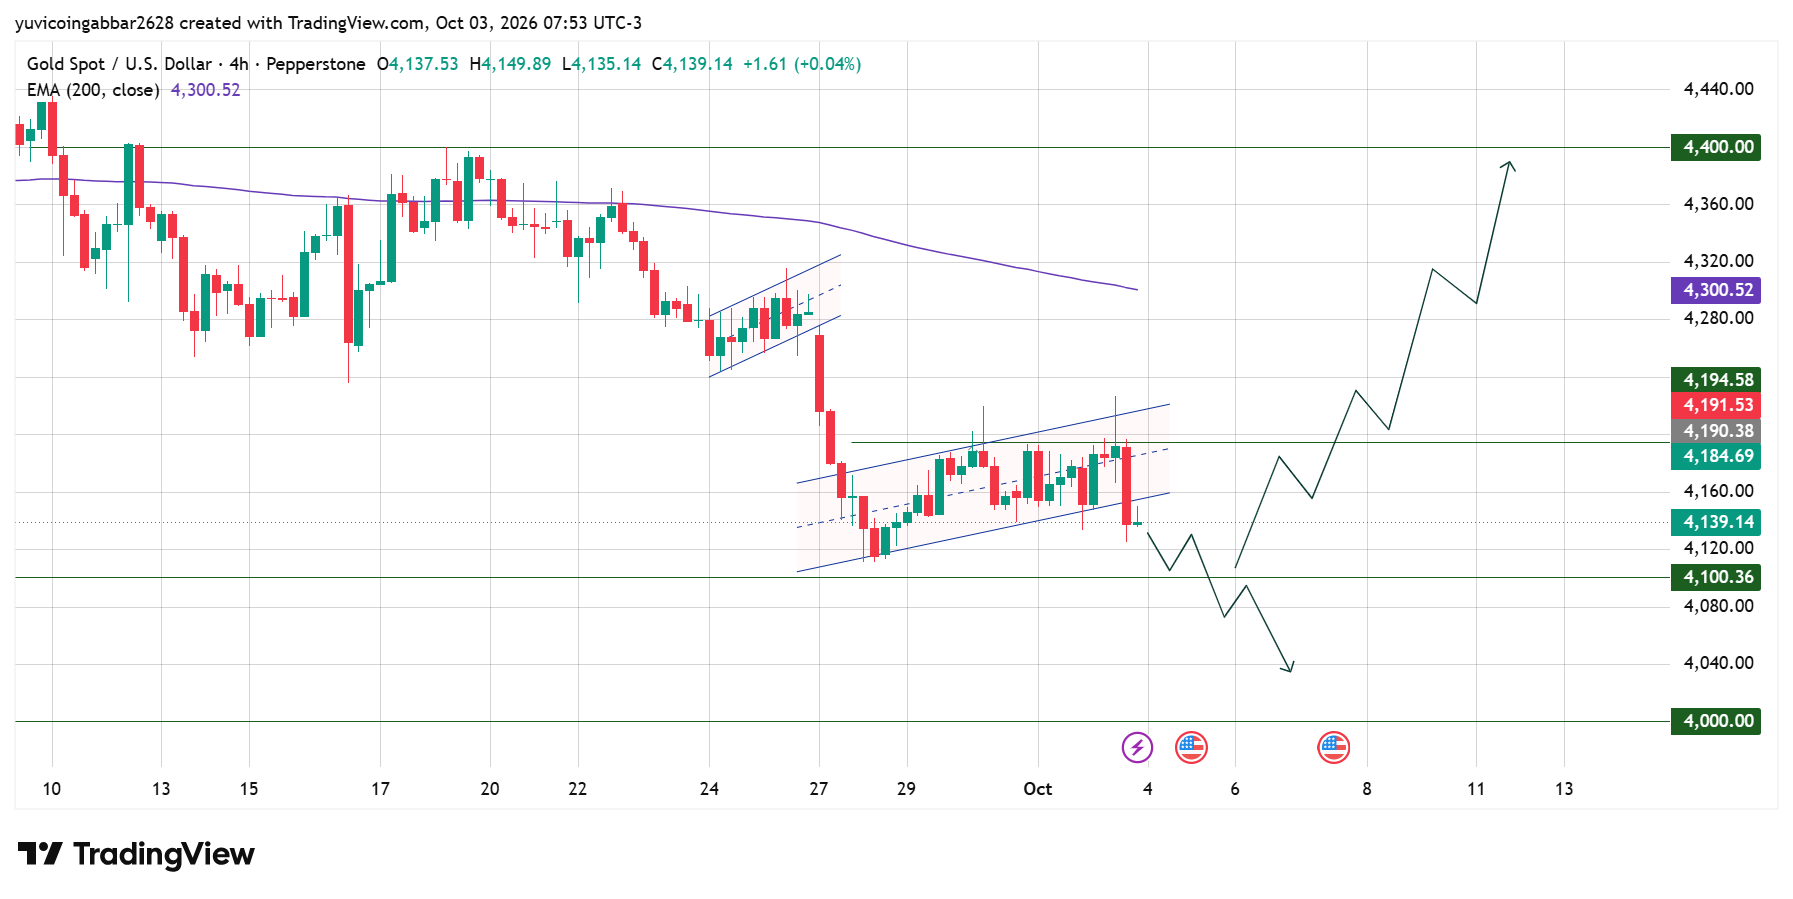
The 4-hour chart shows that gold previously formed an ascending channel after the sharp decline toward the $4,100 area. Price then moved higher within the channel but failed to sustain the move and recently dropped toward the lower boundary.
This makes the $4,100 level important.
If buyers defend this support and price starts creating higher lows, the first recovery target is around 4,190-4,195. A confirmed breakout above this resistance zone could improve the short-term structure and open the way toward the 200 EMA at $4,300.52.
However, the 200 EMA remains a major hurdle. Gold is currently below this moving average, so a temporary bounce should not automatically be treated as a trend reversal.
A sustained move above the 200 EMA would provide stronger confirmation that buyers are regaining control.
Gold Price Forecast: Can Gold Reclaim $4,300?
The $4,300 area is the key technical level for the next major move.
The 200 EMA is currently positioned at $4,300.52, making it an important dynamic resistance. Gold would need to reclaim this level and hold above it to strengthen the bullish setup.
If XAU/USD breaks above $4,300.52 and maintains the level, traders could watch $4,400 as the next major resistance shown on the chart.
The move would therefore look like
$4,100 support → 4,195 resistance → $4,300.52, 200 EMA → $4,400
This does not mean gold will necessarily reach $4,400. Each level needs confirmation from price action.
Gold Outlook Bull Case: Can XAU Reach $4,400?
The bullish scenario depends first on gold holding the $4,100.36 support.
If buyers defend this zone and the price moves back above 4,195, momentum could improve. A confirmed breakout above the 200 EMA at $4,300.52 would provide another bullish signal.
In that scenario, $4,400 becomes the next major level to watch.
The bullish setup would therefore require three steps:
-
Hold $4,100.36 support.
-
Reclaim 4,190-4,195.
-
Break and sustain above $4,300.52.
If all three levels are reclaimed, the $4,400 area could come into focus.
Gold Forecast Bear Case: What If Gold Breaks $4,100?
The bearish scenario becomes stronger if gold fails to hold $4,100.36.
A confirmed break below this support could invalidate the current recovery structure and expose the next downside area near $4,040, based on the projection shown on the chart.
If selling pressure continues below $4,040, the $4,000 psychological level becomes the next important area to watch.
The bearish path would therefore be:
Break $4,100 → $4,040 → $4,000
A quick wick below support would not necessarily confirm a breakdown. Traders should watch for a sustained move or confirmed candle close below the level before treating the support as broken.
Gold Price Prediction: What Should Traders Watch Next?
The current setup is centered around the battle between $4,100 support and the $4,300.52 200 EMA.
Gold is closed between these two important levels, which means the next confirmed breakout could provide more clarity.
If the price holds at $4,100 and reclaims 4,195, buyers could attempt another move toward $4,300.52.
On the other hand, losing $4,100 could shift attention toward $4,040 and then $4,000.
For now, the key question is not simply whether gold will rise or fall. The more important signal is whether buyers can defend $4,100 and eventually reclaim the 200 EMA.
Gold Price Prediction 2026: Expert View
According to CoinGabbar analysts , the current Gold Price Prediction setup remains dependent on the $4,100 support zone. Holding this level could give bulls another opportunity to recover toward 4,190-4,195 and eventually test the 200 EMA at $4,300.52.
However, the structure remains vulnerable while gold trades below the 200 EMA. A break below $4,100 would shift the focus toward $4,040 and $4,000.
The next confirmed breakout or breakdown should provide a clearer signal about gold's short-term direction.
Disclaimer
This article is for informational purposes only and isn't financial advice. Price levels and scenarios are based on technical analysis and are not guarantees. Gold and financial markets can be highly volatile, so always conduct independent research before making any trading or investment decision.







.webp)








