Pepe Price Prediction: Can PEPE Clear $0.00000462 After ETF News?


The Pepe price prediction October 2026 story has a headline that points up and a price that points down. A post says Canary Capital filed an amendment for a spot PEPE ETF, yet $PEPE is down 5.4% over 24 hours.
Pepe launched in April 2023 as an Ethereum-based meme coin inspired by the Pepe the Frog internet character.
It reached a multi-billion-dollar market cap in 2024 and now ranks among the largest meme coins by market value.
For the latest Pepe price today, the coin trades at $0.00000428, down 5.4% over 24 hours. It ranks #59 by market cap at $1.803B, and its 24-hour range runs from $0.00000411 to $0.00000453.
Pepe Live Data
Metric | Value |
Price | $0.00000428 |
24h Change | -5.4% |
24h Range | $0.00000411 - $0.00000453 |
Market Cap | $1.803B |
Market Cap Rank | #59 |
Source: market data taken from CoinGecko, as of Oct 3, 2026. Figures may vary slightly across other tracking websites.
Pepe (PEPE) News Today
The latest Pepe news is a post from TMA | The Money Ape saying Canary Capital filed an S-1 amendment for a spot $PEPE ETF, with plans to list it on Cboe BZX.
The attached image shows the pre-effective amendment to the Form S-1 filed with the SEC. The post asks whether more ETF approvals could bring back meme season.
An S-1 amendment is a step in the registration process, not an approval or a launch date.
The post gives no timeline for effectiveness or trading. It also cites a gain of more than 17,000% for $PEPE in the 2023 to 2024 cycle, a figure it does not source.
Source: Data taken from @TheMoneyApe, X Account, as of Oct 3, 2026
The post was about 16 minutes old at capture, so the 24-hour decline came before it. Traders will now watch whether volume responds.
Pepe (PEPE) Technical Analysis
This Pepe technical analysis uses the daily (1D) $PEPEUSDT chart on Binance, captured at 16:34 IST on October 3, 2026.
The current daily candle was still open at capture and closes at about 05:30 IST on October 4 (00:00 UTC), and every level here refers to daily closes.
Price sits inside an ascending channel that has guided the rally since the August 18 low. The channel's upper line reaches the $0.00000597 resistance near mid-October, and the dashed midline runs near $0.00000470.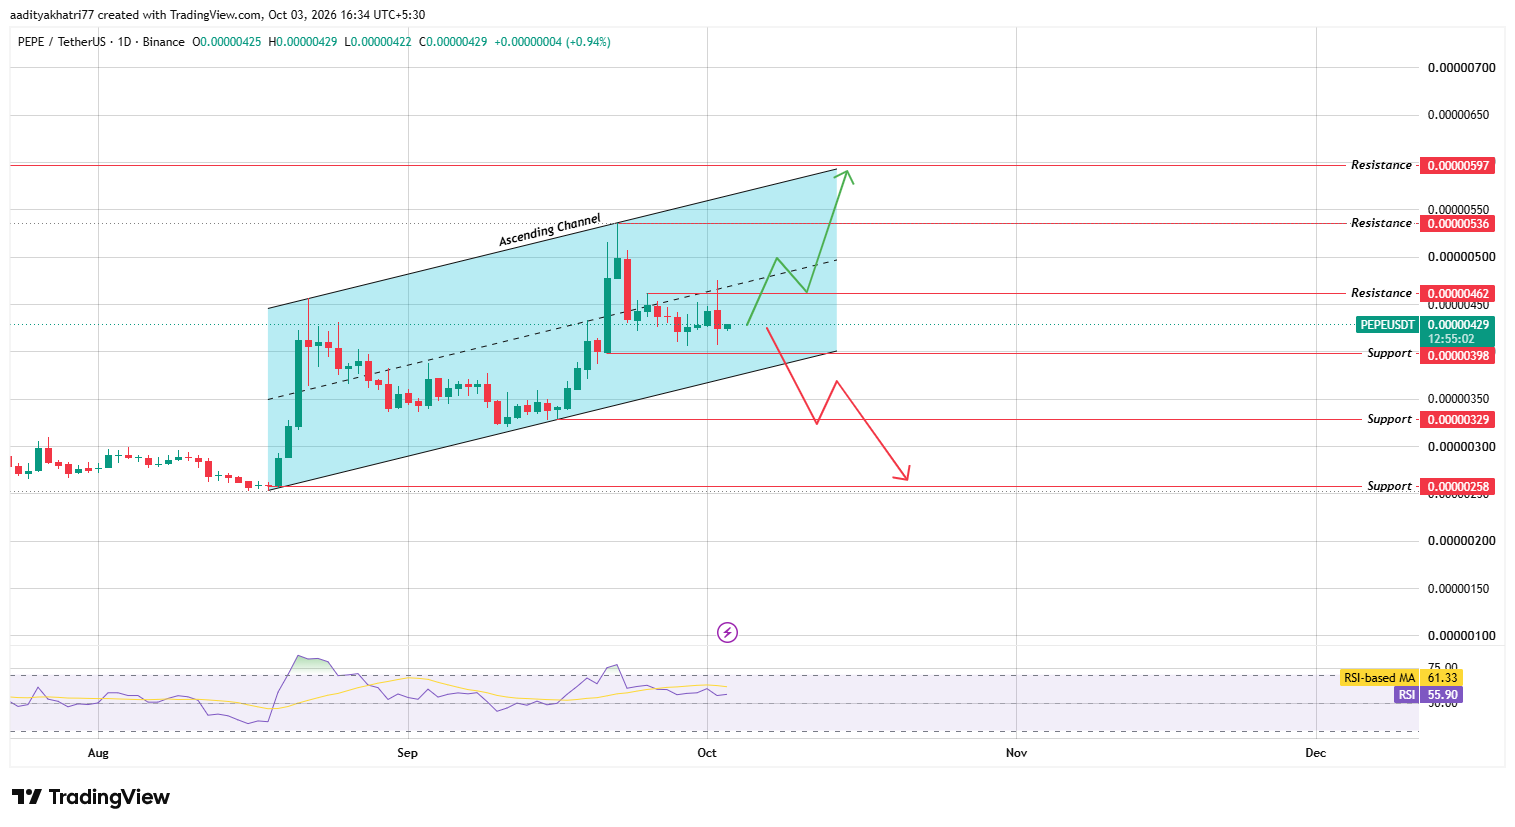
Source: Chart taken from TradingView, Binance PEPEUSDT, October 3, 2026
Price topped at $0.00000536 on September 22 and has since drifted lower inside the channel.
At capture, the price sat at $0.00000429, below the midline and about 7.2% above the $0.00000398 support.
The lower channel boundary runs near $0.0000037 on this chart and rises toward the support level by mid-October.
The daily candle is up 0.94% after opening at $0.00000425, while CoinGecko shows a 24-hour drop of 5.4%.
The two readings differ because the drop came before the current daily candle opened, when the price fell from the 24-hour high of $0.000004533.
The RSI reads 55.90 and sits below its moving average at 61.33. Momentum has cooled from the September rally but remains above the 50 midline.
Can $PEPE Push Toward Higher Resistance?
The bullish case starts with a bounce from the lower half of the channel. The first barrier is the $0.00000462 resistance, about 7.7% above the current price, which sits close to the channel midline.
A real breakout needs a daily candle close above $0.00000462, with volume at least 1.5 times the average of the previous 20 daily candles. A close on weaker volume would leave the move open to a fade.
If that happens, the next stop is $0.00000536, about 24.9% higher than the September 22 high.
A further push could reach $0.00000597, near 39.2% above, where the upper channel line sits in mid-October. The ETF headline could add demand, but an S-1 amendment is not an approval.
What Happens If $PEPE Breaks Support?
The weaker path begins if the price loses the $0.00000398 support, about 7.2% below the current price. A daily close below it on the same 1.5x volume threshold would break support.
A close below the lower channel boundary, near $0.0000037, would confirm a breakdown of the channel itself.
The next supports are $0.00000329, about 23.3% lower, and $0.00000258, near 39.9% below. That last level matches the August low where the channel began.
The RSI below its moving average gives the setup a cautious lean until a resistance break proves otherwise.
Price Levels to Watch
Support | Resistance |
$0.00000398 | $0.00000462 |
$0.00000329 | $0.00000536 |
$0.00000258 | $0.00000597 |
Bull, Base, and Bear Scenarios
Scenario | Setup | Level |
Bull | Bounce inside the channel, daily close above $0.00000462 with rising volume | $0.00000536, then $0.00000597 |
Base | Price stays inside the channel between support and resistance. | $0.00000398 - $0.00000462 |
Bear | Daily close below $0.00000398 and the lower channel boundary with rising volume | $0.00000329, then $0.00000258 |
Pepe vs Bitcoin
$PEPE fell 5.4% in dollar terms and 3.5% against Bitcoin. That gap implies Bitcoin also dropped by roughly 2.0%, so Bitcoin explains about 2.0% of PEPE's decline, and the other 3.5% belongs to $PEPE itself.
$PEPE usually follows the direction of Bitcoin with wider swings. A steadier Bitcoin price would help price hold the lower half of the channel, while a deeper BTC pullback would put the $0.00000398 support in play.
Methodology
This Pepe price prediction relies on three sources. Price levels, the channel lines, and the RSI come from the Binance $PEPE daily chart on TradingView.
Market data comes from CoinGecko, and the news item comes from a public X post.
Every level is tied to daily candles, so a signal counts only after a full daily close. Percentage moves are measured from the chart price of $0.00000429.
The channel midline and lower boundary levels are read from the chart and are approximate. The Pepe price forecast will shift as new daily candles close.
Expert Opinion
General market commentary often treats ETF filings as a sentiment boost for meme coins, but a filing is not a launch.
Approvals and listing dates decide whether demand follows, and none appear in the post.
The post's question about more ETF approvals is a hope, not data. If demand does arrive, it should show up as rising volume on a daily close above the first resistance.
On this daily chart, the first decision points are $0.00000462 on the upside and $0.00000398 on the downside. For readers following the wider top memecoins, a close look outside the channel will matter more than any single headline.
Disclaimer: This article is for information only and is not financial advice. Crypto prices are volatile, and an ETF filing does not guarantee approval, a launch, or a price move. $PEPE can fall below every support level named here, and a failed breakout can reverse quickly. No scenario is guaranteed, and readers should research independently and invest only what they can afford to lose.







.webp)








