Gold Price Prediction: XAU/USD IMP Key Support! Is Gold Ready for $5K?


Gold is facing another important test after a sharp pullback from recent highs. This Gold Price Prediction looks at whether buyers can defend the key support zone near $4,100 while strong gold ETF demand provides a potential bullish signal.
According to the latest market update shared by Global Markets Investor, gold ETFs added 143,200 troy ounces, extending their buying streak to five consecutive trading days. The post also said total known ETF holdings reached 100.9 million ounces, the highest level since August 2022.
This creates an interesting divergence. Gold prices have pulled back, but ETF investors are still adding exposure. The key question now is whether this demand can help buyers rebuild momentum or whether the ongoing correction will push XAU/USD below its major support.
Gold Price Today Holds Near $4,100 After Sharp Pullback
On the latest daily chart, gold price today is trading around $4,156.99 after moving lower from the $4,700 area.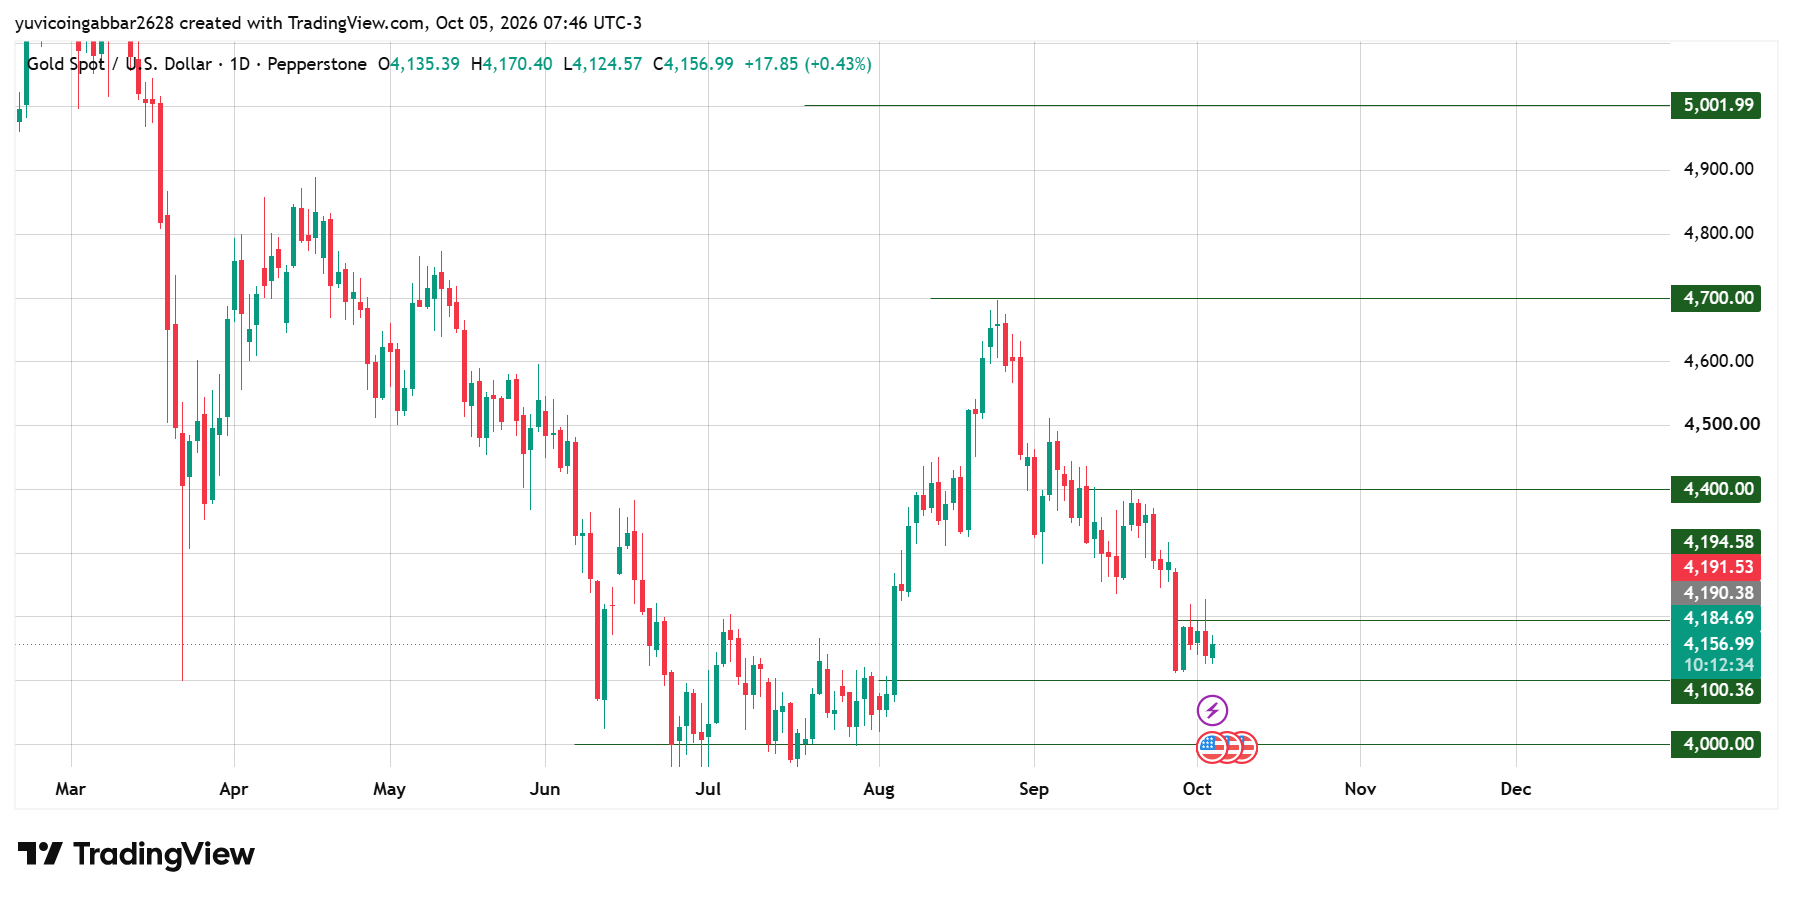
The chart shows a clear correction from the recent high, with sellers pushing the price toward the marked $4,100.36 support.
The important part of the setup is that gold has not yet broken this support. Buyers are still defending the area, keeping the possibility of a rebound alive.
The broader chart also shows that the previous move toward higher levels was followed by a strong pullback. Therefore, the next few candles around $4,100 could determine whether gold starts building a new base or continues lower.
Gold Forecast: Gold ETF Buying Adds a Bullish Signal
The latest ETF data gives bulls an interesting reason to remain cautious rather than assuming the correction is the start of a deeper collapse.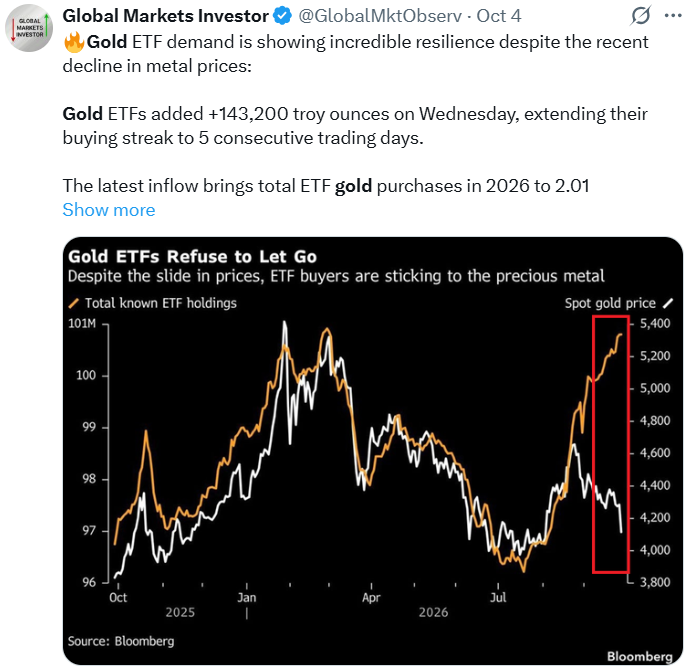
Source: Data From X
Gold ETFs reportedly added 143,200 ounces in the latest session, marking five straight trading days of buying. Total known holdings reached 100.9 million ounces.
The World Gold Council has also reported strong global gold ETF demand, with August inflows of $18 billion and holdings reaching a record 4,189 tonnes by the end of August.
This does not guarantee an immediate gold rally, but continued ETF accumulation suggests that some investors are using the price weakness to increase exposure.
That makes the $4,100 support even more important from a technical perspective.
Gold Technical Analysis: Key Support and Resistance
Level | Type | Importance |
$5,001.99 | Resistance | Major upside level |
$4,700 | Resistance | Major resistance |
$4,400 | Resistance | First major bullish target |
4,184.69-4,194.58 | Resistance | Immediate resistance zone |
$4,156.99 | Current Price | Current chart level |
$4,100.36 | Support | Key support |
$4,000 | Support | Major lower support |
Immediate Resistance
Gold is currently below the 4,184.69-4,194.58 resistance zone.
A sustained move above this area would improve the short-term structure and could give bulls a chance to push toward $4,400.
The $4,400 level is therefore the first major upside area to watch after the immediate resistance zone.
Key Support
The most important level on the downside is $4,100.36.
If buyers continue defending this level, gold could attempt another rebound. However, a confirmed daily breakdown below $4,100.36 would weaken the current setup and bring the $4,000 support into focus.
Why Are Central Banks Still Buying Gold?
Central banks continue adding gold as they look to diversify reserves and protect against geopolitical and financial uncertainty. The World Gold Council says 89% of reserve managers expect global central bank gold holdings to rise over the next 12 months.
Gold Price Prediction: Can Gold Reclaim $4,400?
The answer depends mainly on the $4,100 support and the 4,184-4,195 resistance zone.
Bullish Scenario
If gold holds $4,100.36 and breaks above the 4,184.69-4,194.58 resistance zone, bullish momentum could strengthen.
A sustained move above this resistance would put $4,400 back in focus. If buyers eventually clear $4,400, the chart shows higher resistance near $4,700 and then $5,001.99.
The ETF buying trend could provide additional support to this bullish scenario, although ETF flows alone do not confirm a price breakout.
Bearish Scenario
If gold fails to reclaim the 4,184.69-4,194.58 zone and sellers push price below $4,100.36, the short-term structure would weaken.
A confirmed break below $4,100.36 could expose the next major support at $4,000.
This level becomes especially important because losing $4,000 would indicate that the current correction is extending rather than simply forming a short-term base.
Gold Forecast: What Should Gold Traders Watch Next?
The chart comes down to three key questions:
Can gold hold $4,100.36?
Can buyers reclaim 4,184.69-4,194.58?
Can a confirmed breakout above that zone send XAU toward $4,400?
For bulls, holding $4,100.36 and reclaiming the immediate resistance zone would improve the setup.
For bears, a break below $4,100.36 would shift attention toward $4,000.
Meanwhile, the continued ETF buying is an important market-demand signal because investors appear to be adding gold exposure even during the pullback.
Gold Outlook: Expert View
According to CoinGabbar analysts, the latest chart suggests that $4,100.36 is the make-or-break support for gold, while 4,184.69-4,194.58 is the first resistance zone that bulls need to reclaim.
The ETF buying data adds a constructive backdrop, but the price still needs to confirm the move technically. A successful recovery above the immediate resistance zone could reopen the path toward $4,400, while a break below $4,100.36 could expose $4,000.
The key signal is simple: support holds and resistance breaks, or support fails and the correction continues.
Disclaimer
This Gold Price Prediction is based on the technical levels shown on the provided TradingView chart and publicly reported market information. Technical levels can change quickly, and ETF buying does not guarantee higher gold prices. This article is for informational purposes only and is not financial advice.










.webp)






