Hedera Price Prediction November 2026: Can Bulls Reclaim $0.08167


Is a 39.49% monthly drop enough to flush the sellers out?
Longs just lost $765.27K in 24 hours, and the price still sits under the EMA.
This Hedera Price Prediction November 2026 starts at $0.07374, with the price stuck in a falling channel. Earlier coverage tracked HBAR BOI AI news, but this view sticks to price, flows, and positioning.
HBAR Price Forecast Market Snapshot
A Hedera Price Prediction is a read on levels and flows, so the data comes first. CoinGecko market data as of Oct 29, 2026, lists the figures below.
Metric | Value |
Price | $0.07374 |
24h change | -3.4% |
24h range | $0.07291 to $0.07688 |
Market cap | $3.268B |
FDV | $3.687B |
24h trading volume | $98.464M |
Perps 24h open interest | $258.157M |
Circulating supply | 44.327B |
Source: CoinGecko market data, captured Oct 29, 2026, 9:40 UTC.
FDV (fully diluted value) is the market cap if all 50B tokens were already circulating, and today, 44.327B are.
HBAR Resistance Levels and Price Performance
CoinGlass price change data shows HBAR down 12.00% over 7 days and 39.49% over 30 days.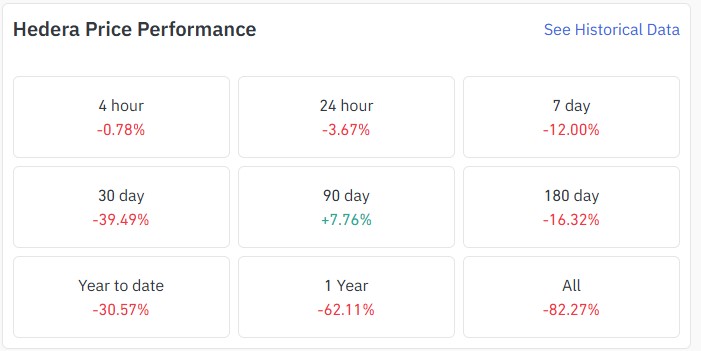
Source: CoinGlass price change data, captured Oct 29, 2026, 9:40 UTC.
The 90-day gain of 7.76% keeps the longer view from turning fully red. But the 1-year drop of 62.11% still weighs.
Price trades 1.14% above the 24h low of $0.07291. And the 24h high of $0.07688 sits 4.08% overhead.
Price is 43.7% under the late September high of $0.13089, per the chart. The nearest resistance, $0.08167, sits 10.75% above.
HBAR ETF Flows Stay Flat
SoSoValue ETF data as of Oct 28, 2026, shows a $0.00 daily net inflow for Canary's HBR fund on NASDAQ.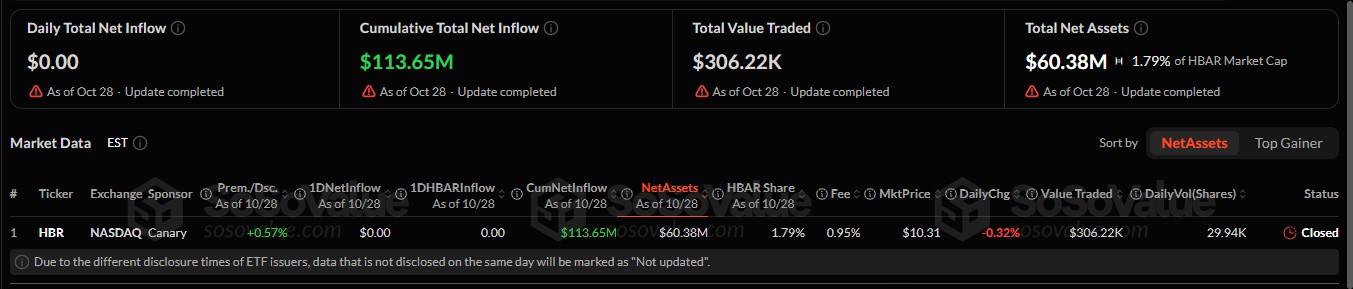
Source: SoSoValue ETF data, as of Oct 28, 2026, UTC.
ETF net assets (the value of coins a fund holds) total $60.38M, or 1.79% of HBAR market cap. Cumulative net inflow is $113.65M. SoSoValue marks late issuer filings as not updated, so the Oct 28 figures may shift.
A flat day isn't an outflow, so the data shows a pause, not an exit. More context sits in Hedera stablecoin supply news.
HBAR Liquidation Data: Longs Took a Hit
Longs took the hit. CoinGlass liquidation data as of Oct 29, 2026, shows $773.63K wiped out in 24h.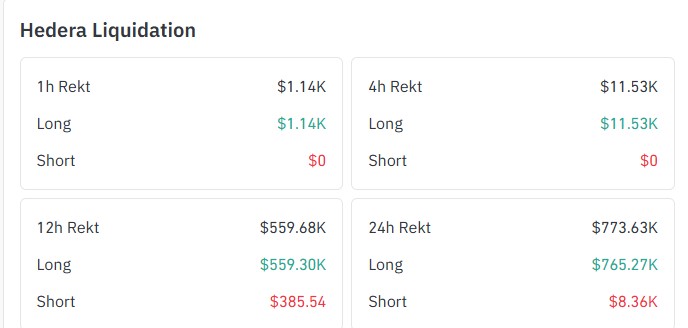
Source: CoinGlass liquidation data, captured Oct 29, 2026, 9:40 UTC.
Buyers lost $765.27K in 24 hours, while shorters just lost $8.36K.
Most of it landed in the last 12h. Longs lost $559.30K there, while shorts lost $385.54. Over the last 4h, the pace slowed to $11.53K.
HBAR Open Interest and Futures Volume
Open interest is the value of futures contracts still open. CoinGecko lists perps 24h open interest at $258.157M as of Oct 29, 2026.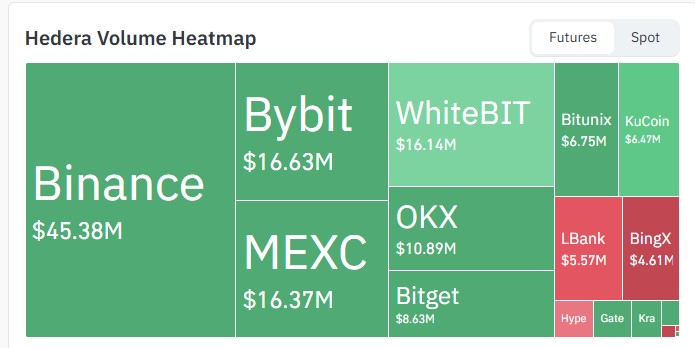
Source: CoinGlass futures volume heatmap, captured Oct 29, 2026, 9:40 UTC.
Binance leads futures volume at $45.38M. Bybit is second at $16.63M, so the gap is $28.75M. Two venues, Bybit and MEXC, sit just $0.26M apart.
So who's driving the price, spot buyers or futures traders?
Hedera Price Prediction November 2026: Technical Analysis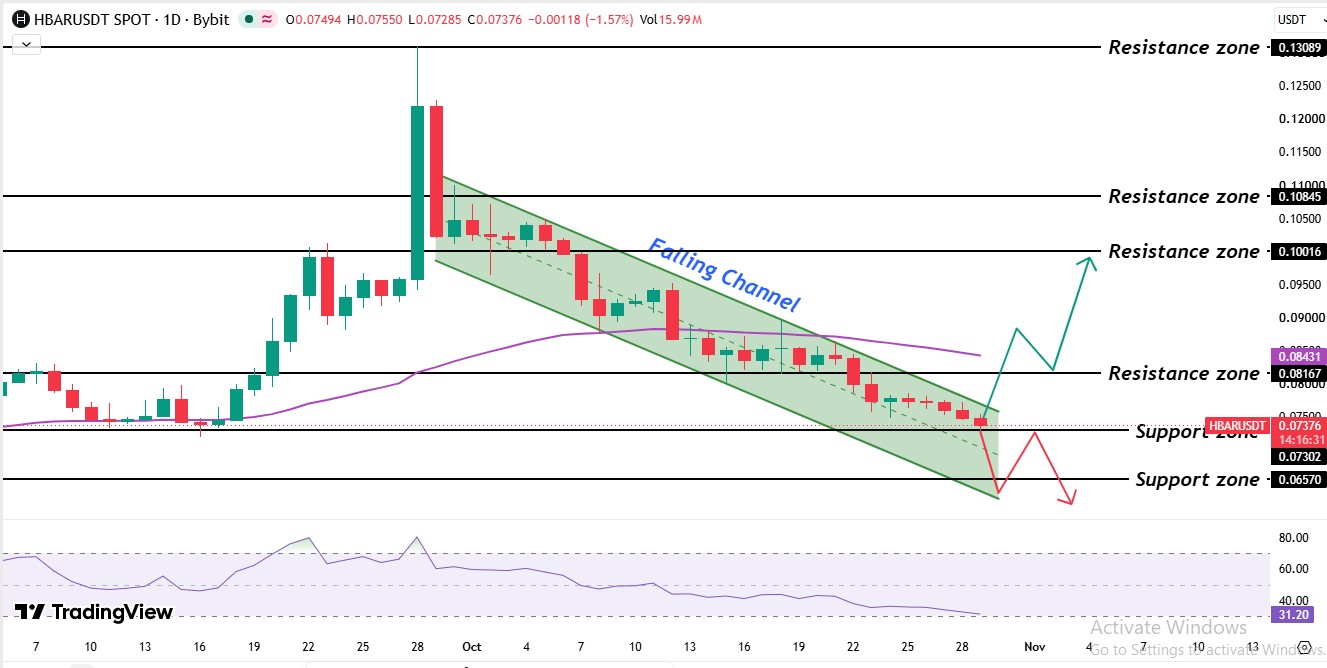
Source: TradingView, Bybit $HBAR/USDT spot, daily, captured October 29, 2026, around 09:43 UTC.
This Hedera price prediction starts with a price consolidation between the $0.07302 level and the $0.08167 level in September. A breakout followed, and the first price tested the $0.10016 level, and after a bit of consolidation.
A price spike to the $0.13089 level came on Sept 28. Since then, the price has made lower highs and lower lows and formed a falling channel, and the price is still trading inside the channel.
The 50 EMA (exponential moving averages) sits at $0.08431. Right now 50 EMA is also acting as resistance, so buyers need to flip it first.
RSI (relative strength index) reads 31.20. That's just above the 30 line that marks oversold, so selling momentum is stretched but not exhausted.
HBAR Support and Resistance Levels
Type | Level |
Support | $0.07302 |
Support | $0.06570 |
Resistance | $0.08167 |
Resistance (50 EMA) | $0.08431 |
Resistance | $0.10016 |
Resistance | $0.10845 |
Resistance (wick high) | $0.13089 |
HBAR support levels start at $0.07302, and the nearest ceiling is $0.08167. The 50 EMA at $0.08431 sits just above it, and $0.13089 is the Sept 28 wick high.
HBAR Bull, Base, and Bear Scenarios
Scenario | Trigger | Target | Invalidation |
Bull | Daily candle trades above the channel top and $0.08167 | $0.10016 | Daily candle back under $0.07302 |
Base | Daily candles hold between $0.07302 and $0.08167 | Range trade | Daily candle breaks either level |
Bear | Daily candle trades below $0.07302 | $0.06570 | Daily candle above $0.08167 |
Triggers use the daily candle, not intraday wicks. Targets are the nearest chart levels.
Regulatory delay can stall ETF demand. A reversal in ETF flows to net outflows would add selling. And a daily candle under $0.07302 voids the bounce case.
Hedera Price Prediction November 2026: Expert Outlook
As per CoinGabbar analysis, the setup is bearish. Price sits under the 50 EMA, ETF net inflow was $0.00 on Oct 28, and longs lost $765.27K in 24h.
The Hedera Price Prediction stays bearish while the daily candle trades under $0.08167. A daily candle below $0.07302 puts $0.06570 in play.
Watch the $0.07302 support zone. A daily candle under it while open interest holds above $258.157M would confirm fresh sellers, not a washout.
Disclaimer: This article is for information only and isn't financial advice. Traders should do their own research and risk only what they can afford to lose.