Hedge Funds De-Grossing Hits 7.8%: Is Crypto Next?


Why Fund Risk Cuts Matter to Crypto Readers Today
Large investors often change their positions before smaller traders notice a shift in the market mood. Readers who follow crypto news today often watch these moves to understand how risk is being priced across markets.
Hedge Funds De-Grossing Reaches a 7.8% Drop
Hedge fund de-grossing reached 7.8% from its recent peak, according to a chart from Steno Research founder shared on X.
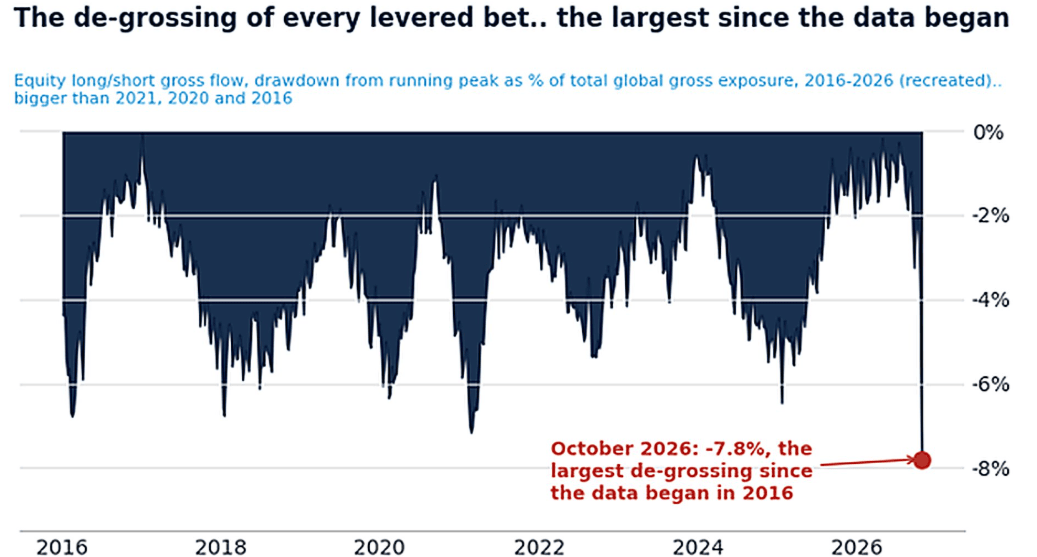
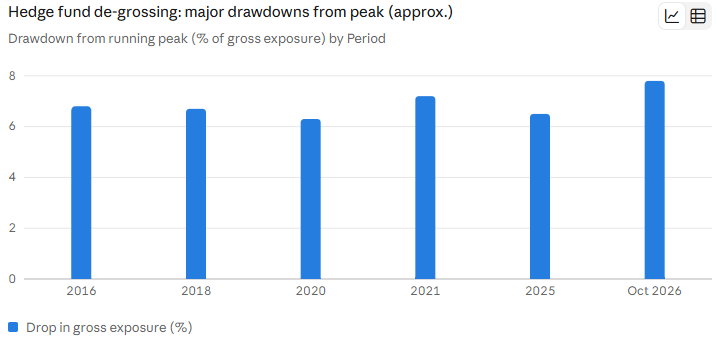
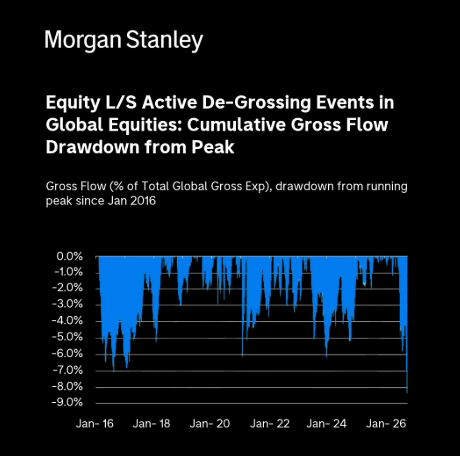
The chart is based on Morgan Stanley Prime Brokerage data as of Oct 2026, and the figures are described as approximate. It shows the largest drop in that dataset, which begins in 2016, and it is bigger than the moves seen in 2016, 2020, and 2021.
What De-Grossing Means for Long/Short Equity Funds
Gross exposure is the total size of a fund’s long and short positions added together. When a fund cuts gross exposure, it is reducing the overall amount of risk it carries in the market.
In simple words, de-grossing means funds are closing trades and holding less borrowed money, which can happen when managers want to lower risk quickly.
Is Forced Selling Close to Running Out?
The update that shared the chart argues that forced selling tends to fade once most sellers have already sold.
This is an opinion from the account that shared it, and it is not a proven rule. Markets can move in many directions after a large risk cut, so readers should treat this view as one possible outcome and not as a forecast.
How Hedge Funds De-Grossing May Affect Bitcoin and Crypto Prices
Bitcoin and other digital assets are often grouped with risk assets, which means they can feel pressure when large funds reduce risk. Some analysts say stock market selling can spill into crypto when traders lower leverage across all markets.
The chart does not mention crypto, so any link between this move and crypto prices remains possible and not confirmed.
Leverage, Liquidity, and Risk-Off Signals Traders Watch
Crypto traders often follow leverage levels, trading volume, and funding rates to see whether the market is in a risk-off mood. A fast cut in stock market risk can show that big investors want more safety, and this mood can reach crypto through liquidity and trader sentiment.
Many market watchers also check stablecoin flows, because they can show whether money is moving into or out of crypto markets.
Why the Data Source Matters Before You Trade
The above Steno Research chart was recreated from Morgan Stanley Prime Brokerage data and shared by the Morgan Stanley Derivatives X account.
Readers should look for the original note from Steno Research or other official market data before using this figure in any trading plan. A careful check of the source helps avoid decisions based on a chart that may have small differences from the original.
What Crypto Traders Can Watch Next
The next hedge fund positioning updates will show whether the risk cut continues or slows down.
Traders can also follow Bitcoin price moves, stock market direction, and Federal Reserve statements to see whether the broader mood changes. A calm approach, with clear limits on position size, usually works better than reacting to a single chart on social media.
YMYL Disclaimer: This article is for information only and is not financial or investment advice. Crypto markets are volatile, and figures or views can change, so please check official sources before you act.






