How Low Could Ethereum Go? $1,300 or $1,000 If Tom Lee Must Sell ETH


Ethereum trades near $1,627 after a 7.20% fall in 24 hours.
Bitmine holds about 6.08 million ETH with a $10.63 billion paper loss.
The first support zone sits at $1,500, with $1,364.72 below it.
Ethereum is trading near $1,627 after a 7.20% drop in 24 hours. ETH hit a low of $1,536 and a high of $1,762 in that window.
What happens if Tom Lee sells his Ethereum? Bitmine holds about 6.08 million ETH, close to 5% of the circulating supply. Let's discuss what a sale could mean for ETH below.
Ethereum Price Outlook: Tom Lee's Bitmine Is Deep in the Red
Tom Lee's Bitmine holds about 6.08 million ETH. DropsTab data shows the stack is worth $9.52 billion, down $2.06 billion in seven days.
Total invested is $20.15 billion at an average price near $3,315. That leaves an unrealised loss of $10.63 billion, or 52.76%. Realised loss is $0, since nothing has been sold.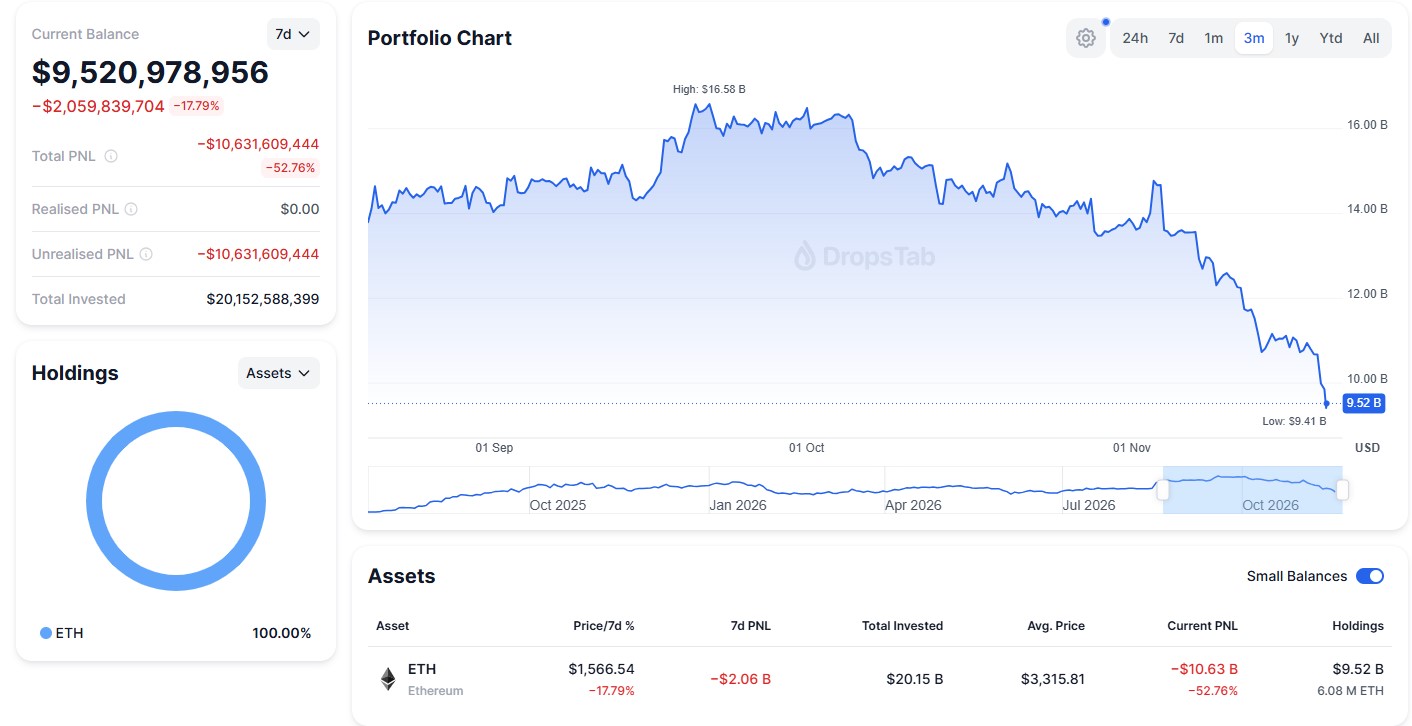
Could Tom Lee Be Forced to Sell?
Nothing in the data shows a forced sale. A paper loss is not a sale. Forced selling usually needs debt, margin calls or heavy redemptions, and none of those show up in the figures here.
Still, size matters. Bitmine's stack is close to 5% of the 122.24 million ETH in circulation. Daily spot volume is $5.53 billion, or roughly 3.4 million ETH at current prices.
A big sale would take a couple of days of full market volume to absorb. Even a rumour of selling from a known buyer could shake nerves. Panic often starts with headlines, not trades.
That is a what-if, not a forecast.
Ethereum Foundation Wallet and ETF Outflows Add Pressure
Lookonchain flagged a wallet linked to the Ethereum Foundation selling another 2,500 ETH, worth about $3.88 million. The amount is small next to daily volume, but the signal is not helpful.
US spot ETFs also look weak. SoSoValue lists a net outflow of $13.18 million on November 20. Grayscale's ETH and ETHE funds led it with $8.70 million and $4.48 million out.
Total ETF assets stand at $9.30 billion, about 1.45% of $ETH market cap. Cumulative inflows are still $11.29 billion, so the funds are not empty.
Derivatives and Macro Add to the Stress
Leveraged traders took the hit. Liquidations reached $583 million in 24 hours, and $497 million came from longs. Open interest fell 7.78% to $21.33 billion.
Funding is flat at 0.0003%. That suggests leverage has been cleared, not that traders turned fully bearish.
Macro is no help. CME data shows an 88.6% chance of a Fed hike to 4.00%-4.25% on December 9.
Arthur Hayes said on October 24 that he sold the coin and moved to the sidelines. He wrote that "we gotta go down to go up."
Key Ethereum Price Levels to Watch
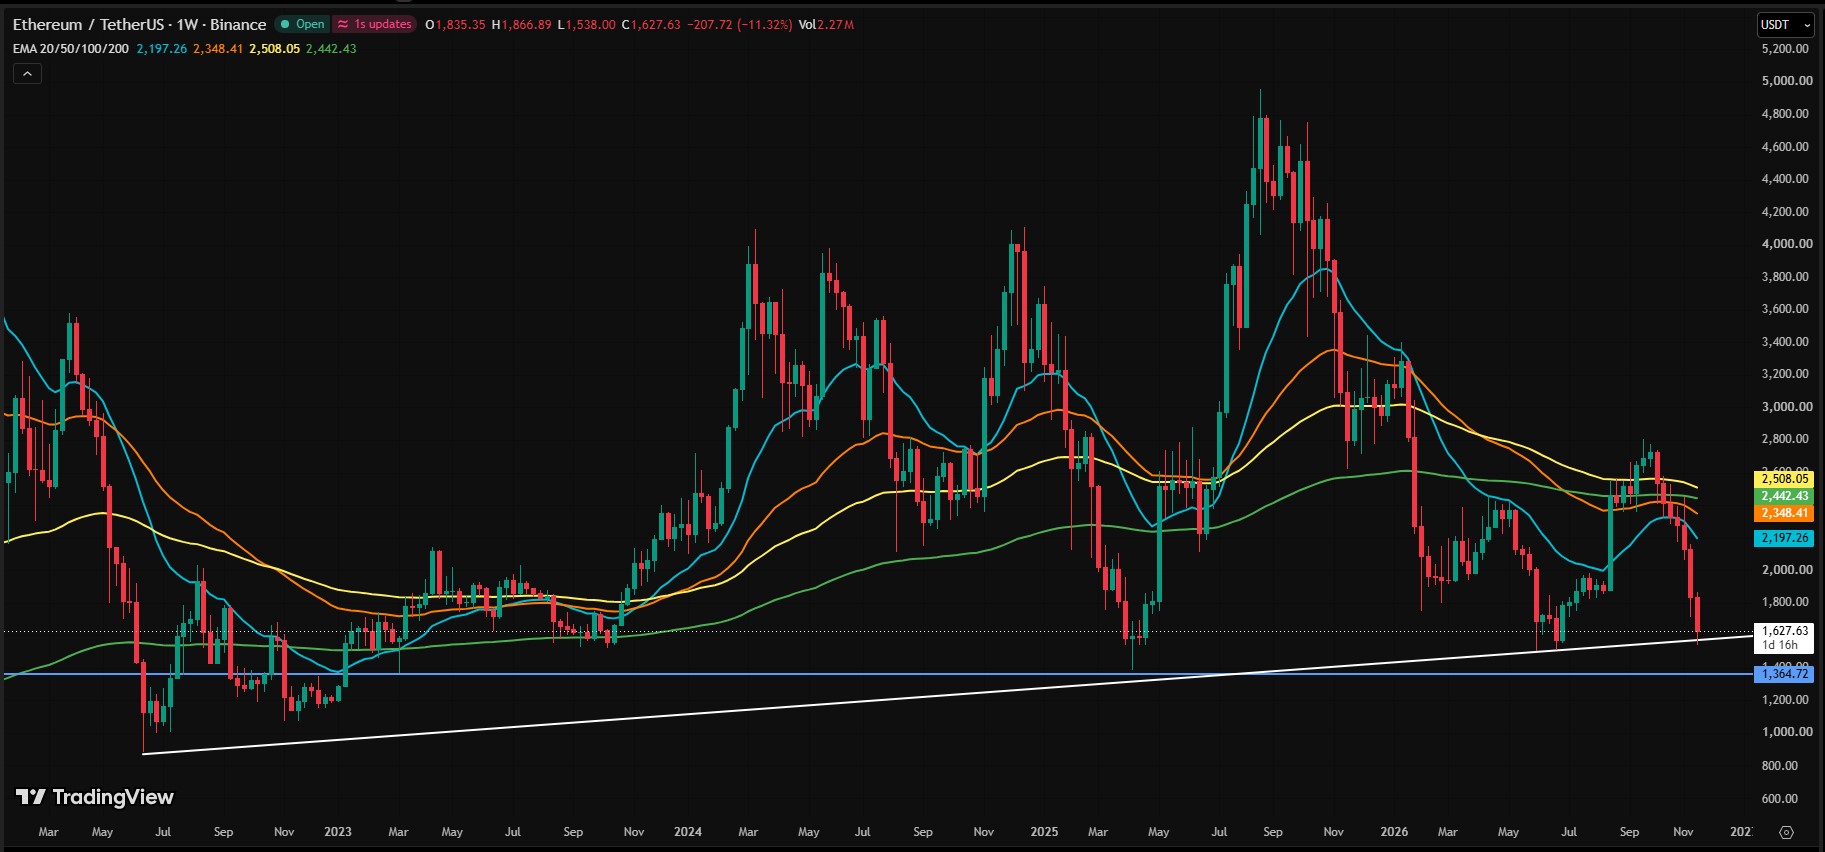
The weekly chart shows the altcoin closing near $1,627, down 11.32% on the week. The 20-week EMA sits at $2,197, the 50 at $2,348 and the 200 at $2,442. All three are above the current price.
Analyst Ella notes the price is back in the $1.5K to $1.8K zone where the last two rebounds began. She wants $1.9K reclaimed and held before calling a bottom.
Level | Distance From $1,627 | Why It Matters |
$1,900 | +16.7% | Level buyers need to reclaim and hold |
$1,762 | +8.3% | 24-hour high and first hurdle |
$1,536 | -5.6% | 24-hour low |
$1,500 | -7.8% | Base of the 1.5K-1.8K rebound zone |
$1,364.72 | -16.2% | Blue support line on the weekly chart |
$1,300 | -20.1% | Round number if the drop deepens |
$1,000 | -38.6% | Deep what-if level, needs heavy panic |
How Low Could Ethereum Go?
If selling continues, the first test is the $1,500 area, close to the weekly low of $1,538. A weekly close below it would put $1,364.72 in focus.
Levels like $1,300 and $1,000 only come into play if that line breaks and fear spreads. A fall to $1,000 would be 38.6% from here. Nobody can promise that outcome.
Ethereum is already 67.1% below its all-time high of $4,953.7. A rising trendline on the weekly chart also sits near today's price.
On the upside, buyers need to defend $1,500 first. Then $1,762 and $1,900 are the next marks. Until that happens, the chart still favours caution.
Disclaimer
This article is for information only and is not financial advice. Crypto assets are volatile, and you can lose all of your money. Price levels mentioned are not guarantees or predictions. Do your own research and speak with a licensed financial advisor before you invest.