HUMA Price Prediction After Jupiter News, Can Bulls Reach $0.015?

Is a 36% jump off a record low a real turn, or a pause in a slide that already wiped out 76% from the $0.03649 high?
Buyers defended $0.00624 on the Nov 16, 2026 daily candle.
Huma Finance has traded near $0.0088 since 07:19 UTC on Nov 17.
This HUMA price prediction starts there. And altcoin price pages rarely show a bounce this sharp.
HUMA Market Data Snapshot
$0.0088 is where Huma trades at 07:19 UTC, up about 36% in 24 hours per CoinMarketCap data.
This HUMA price analysis uses CoinMarketCap, Coinglass, and daily chart data.
Volume of $98.99M against a market cap of $31.11M.
Fully diluted value, meaning the market cap if all 10B tokens traded at this price, sits at $87.85M.
Price still sits 87.37% under the record high of $0.06927.
Why HUMA Is Moving Today
Two posts from Huma explain the move.
Jupiter added PST to its 4USD+ basket. It's live. Huma announced it around 16:20 UTC on Nov 16, per the announcement on X.
Basket buyers get single-click exposure to PayFi, short for payments finance, and other Solana yield assets. A second post adds $8.1M of JupUSD to borrow against PST.
Price jumped. Volume jumped harder, up 1394%.
But this is a DeFi listing, not a new wave of buyers. And a rebound off a record low needs steady demand, which a single basket can't deliver.
HUMA Technical Analysis on the Daily Chart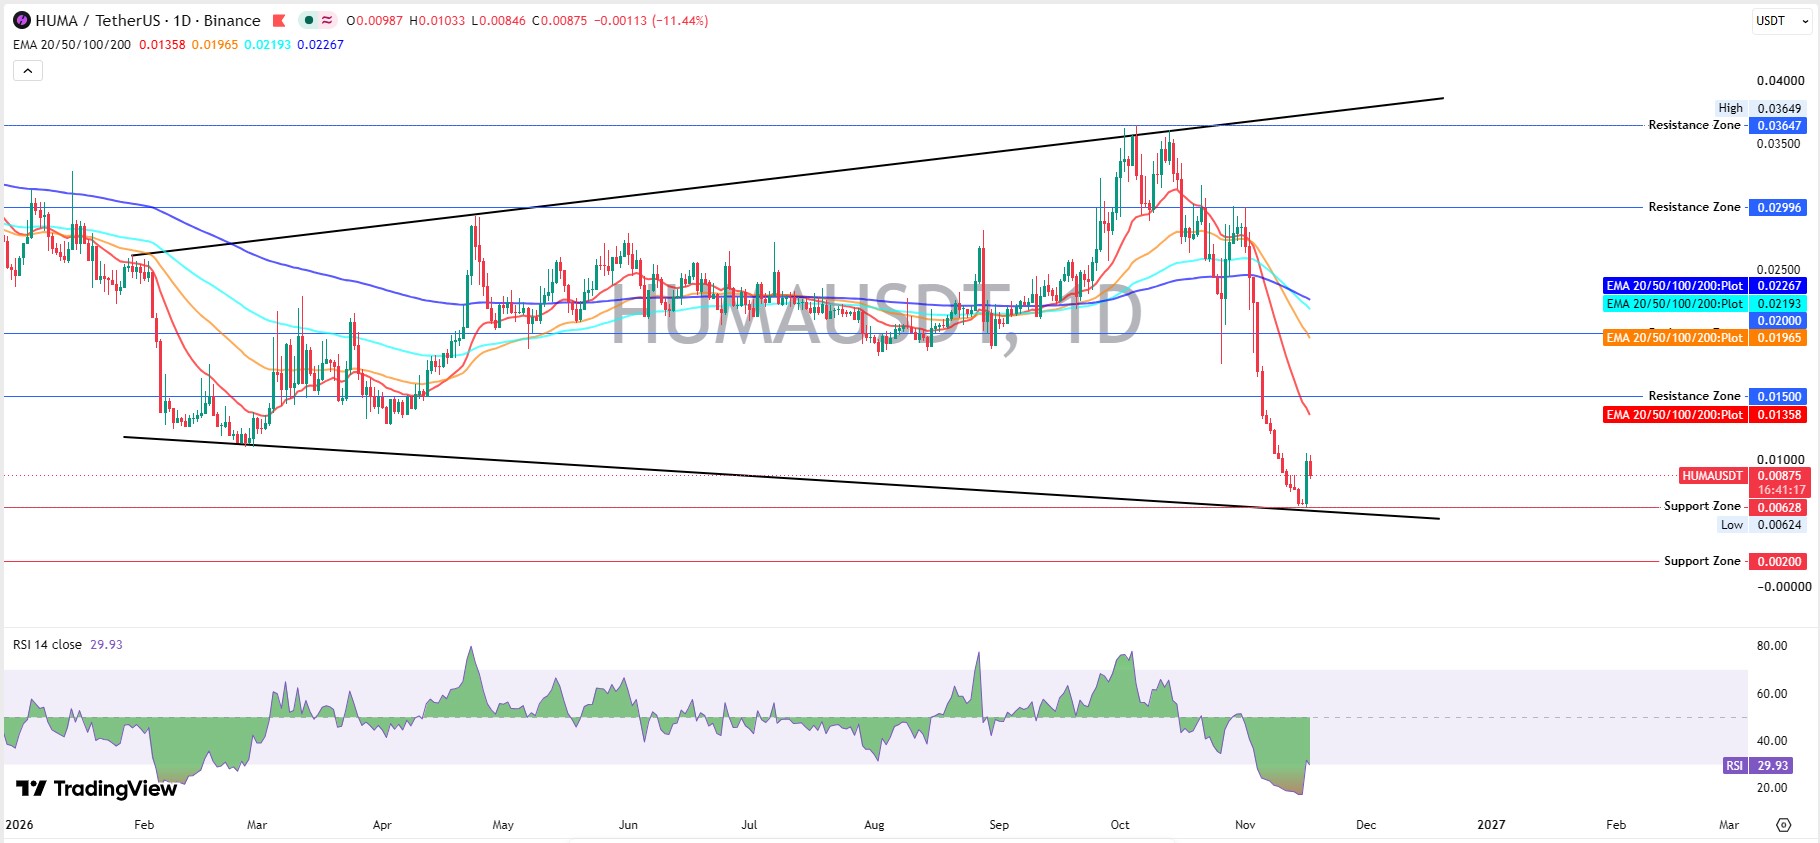
This HUMA technical analysis follows the TradingView daily chart of HUMA/USDT on Binance.
Early February 2026 started near $0.025. Price slid to about $0.011 by early March, the first low of a widening wedge, a pattern where highs rise and lows fall.
From May to August, the price was sideways between $0.018 and $0.027, with the four EMAs tangled around $0.02 to $0.023. An EMA is an average that weights recent days more.
October changed the picture. A push to $0.03649 hit the upper wedge line and the $0.03647 resistance, a ceiling where sellers have shown up before. A second try near $0.0355. Failed.
A bounce to $0.0295 stalled under $0.02996. November then dropped from about $0.0225 to $0.0063.
RSI fell into the high teens. Under 30 means oversold, so selling ran hard. It's back at 29.93.
Price tagged $0.00624 on the lower wedge line, right at $0.00628 support, a floor where buyers have stepped in before. Buyers showed up. And then nothing above $0.01033.
Today's candle opened at $0.00987, hit $0.01033, and trades at $0.00875, down 11.44%.
The bounce is strong. Well, strong in size, not in follow-through.
The 20 EMA is $0.01358, the 50 EMA is $0.01965, the 100 EMA is $0.02193, and the 200 EMA is $0.02267, all sloping down.
Futures Data Behind the Bounce
HUMA open interest, the total USD value of open futures contracts, sits at $21.33M per Coinglass futures data, up 88.92%.
The HUMA funding rate, a fee longs and shorts pay each other, is -1.6149% per 8 hours, or -1768.3% annualized. Negative means shorts pay longs.
So who's selling into this bounce?
Taker buy/sell ratios sit at 0.9710 on Binance, 0.9809 on OKX, 0.9657 on Bybit, and 0.9255 on Gate. Takers use market orders, and a ratio under 1 means sellers hit harder.
Liquidations, forced exits from borrowed-money trades, hit $1.07M in 24 hours, with longs at $575.39K and shorts at $494.75K.
Crowded shorts can still trigger a short squeeze above $0.01033, where forced buybacks push price up. But flows lean to sellers.
Supply and Holder Check
3.54B of 10B tokens circulate, about 35.4%. That leaves 6.46B outside the market, and any release adds sell pressure.
26.11K wallets hold HUMA. BscScan holder data shows whales, wallets with large balances, on the BNB Chain contract.
HUMA Price Prediction Scenarios
HUMA Price Forecast for the Next 7 Days
Liquidity decides which path trades, and new exchange listings can swing it fast.
Scenario | Trigger | Target | Invalidation | Liquidity Condition |
Bull | Daily trading above $0.01033 | $0.01500 | Below $0.00846 | Volume holds near $98.99M |
Base | Range holds | $0.00846 to $0.01033 | Break of either edge | Volume cools, futures stay active |
Bear | Trading under $0.00628 | $0.00200 | Back above $0.00846 | Spot outflows keep growing |
This HUMA price forecast favors the base case, a range from $0.00846 to $0.01033.
Key Levels to Watch
HUMA support and resistance zones come straight from the daily chart.
Support
$0.00846 is today's low. Next is $0.00628, where the wedge line meets the record low. Lose that, and $0.00200 is open.
Resistance
$0.01033 is today's high. Then comes $0.01358 at the 20 EMA and $0.01500, the level that matters most.
Risks That Can Break the Setup
The Fear and Greed Index, a mood gauge for the crypto market, sits at 13, Extreme Fear.
A single basket doesn't build demand, and the 6.46B locked tokens hang over every rally. Small caps also swing with risk appetite, which memecoin market news tracks daily.
And if the wedge line near $0.00628 fails, $0.00200 comes into play.
Where HUMA Stands Now
Bearish. The EMAs sit above price, RSI is still under 30, and today's candle gave back 11.44%. This HUMA price prediction flips only above $0.01500.
Sector context from AI crypto news helps compare how other small caps trade.
Disclaimer. This article is for information only and isn't financial advice. Crypto prices swing hard, and readers can lose their full investment. Research the asset and its risks before trading.