Jupiter Price Prediction: Can JUP Extend Its 31% Weekly Rally?


Jupiter has been climbing along a tidy, disciplined slope, and the market is now watching whether buyers can turn that steady pressure into something bigger.
This Jupiter price prediction weighs how much strength sits behind the move and what could stall it. Trends that look this orderly tend to get tested.
What Is the JUP Price Today After a 12% Jump?
According to Coinglass, Jupiter trades near $0.30, up about 11.9% in 24 hours. The Jupiter market cap stands at $993.72 million, with 3.31 billion tokens circulating out of a fixed 6.86 billion maximum supply.
JUP trading volume is derivatives-heavy, with $151.52 million in futures against $24.82 million in spot, roughly six to one.
Are Long Traders Crowding the Jupiter Rally?
Coinglass performance data shows JUP up 31.07% over seven days and 45.90% over 30 days, though it remains 42.86% lower across one year, so this looks like a rebound against a weaker yearly backdrop.
Positioning leans long, with the Binance account ratio at 2.0276, OKX at 1.79, and top traders at 2.7917 by positions.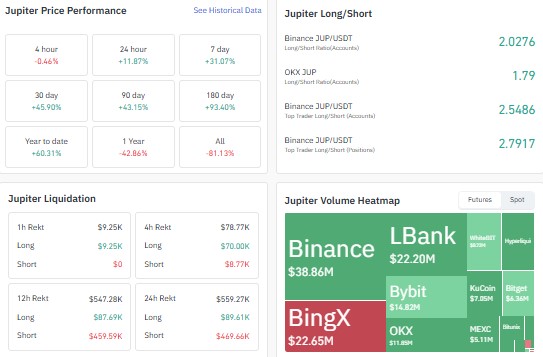
Over 24 hours, $469.66K of $559.27K in liquidations hit shorts, yet the latest four hours flipped, with $70K of $78.77K coming from longs.
A crowded long book and early long flushes argue for care near the top of the range.
Is JUP Open Interest Rebuilding After the September Spike?
JUP open interest has risen to $94.70 million on Coinglass, roughly double the $45 million area of mid-August and not far below the peak just above $100 million on September 7.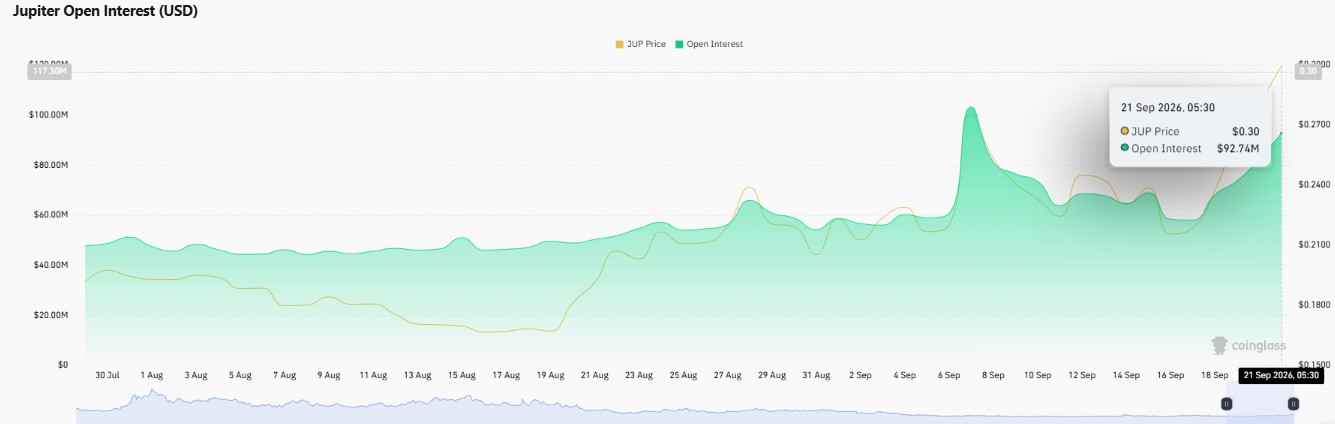
Rising open interest beside a rising price usually points to fresh positions backing the trend.
With futures volume near six times spot, though, leverage is doing much of the work and can reverse quickly.
Is the Jupiter Ascending Channel Ready for a Breakout?
Per TradingView chart data for Token against USD on Coinbase, the 4H chart spent the first half of September mostly between 0.21 and 0.27 before a dip near 0.2087 on September 16 kicked off a steady climb inside an ascending channel.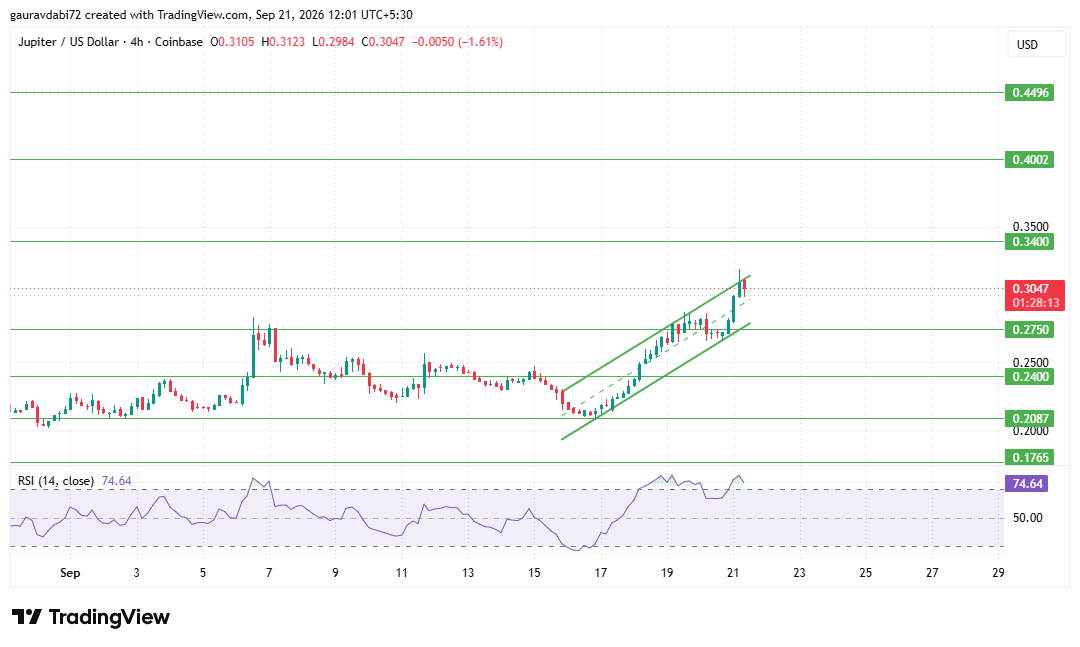
Each pullback found buyers a little higher, and the price has now run into the upper boundary near 0.31.
The latest candle is red, a normal pause when price meets a ceiling.
The 14-period RSI indicator at 74.64 sits in overbought territory, which backs momentum but also raises the odds of a cool-off.
What Are the Key JUP Support and Resistance Levels?
The JUP support and resistance levels are clear on the 4H chart. A break and hold above the channel top opens 0.3400 first, then 0.4002 and 0.4496 if buyers keep supporting the move.
On the downside, 0.2750 is the first support, matching the September 6 high and the lower channel area.
Below it, 0.2400 marks the mid-September range area, 0.2087 the recent low and 0.1765 the deeper floor.
Will JUP Price Go Up if the Channel Breaks?
The Jupiter price prediction hinges on whether buyers can break and hold above the upper channel line.
Acceptance there keeps the ascending structure alive, while rejection sends the price back toward the midline and lower boundary.
Scenario | Trigger | Key Levels |
Bullish | Price breaks the channel top and holds with buyer support. | 0.3400, then 0.4002 and 0.4496 |
Neutral | Price stays inside the channel while RSI cools. | Range between 0.2750 and 0.3400 |
Bearish | The channel breaks down, and the price closes below the lower boundary. | 0.2750, then 0.2400, 0.2087, and 0.1765 |
What Could Stall the Jupiter Rally?
Overbought RSI at the channel ceiling is the first hurdle, since ceilings often draw profit-taking.
Long-skewed ratios and early long liquidations mean a dip could accelerate, and derivatives volume near six times spot leaves the move leaning on leverage.
Only about 48% of the 6.86 billion maximum supply circulates, and a 42.86% one-year decline shows sellers have controlled this token before.
How Does the Analyst Desk Read the JUP Setup?
As per the CoinGabbar analyst desk, Jupiter is doing the right things inside a well-defined structure, but the next step is where trends get proven.
A clean break and hold above the channel top with rising open interest would strengthen the case for 0.3400, while a rejection on fading volume would put 0.2750 back in focus.
Given the yearly drawdown, the desk views this as a rebound that still needs confirmation.
Final Outlook: Is Jupiter Ready for the Next Leg?
The Jupiter price prediction stays constructive while price respects the channel, with 0.3400, 0.4002, and 0.4496 as resistance zones if a breakout is confirmed.
Overbought momentum and long-heavy positioning suggest choppy trading first, so acceptance above the upper line matters more than any single spike.
Disclaimer: This article is for informational purposes only and is not financial, investment, or trading advice. Crypto prices are highly volatile, so readers should assess their own risk before making any decision.


















