KITE Price Prediction: Will the $0.1309 Support Hold This Week?


Buyers are defending the support level at $0.1309, and a daily candle trading below it would shift control to sellers.
This KITE price prediction starts with Kite stalling after a rally and a harder slide. Readers of the earlier KITE analysis will spot the same levels, now retested inside a rising channel.
Where Does KITE Stand in the Market Right Now?
CoinMarketCap market data shows KITE at $0.1343, up 0.35% over 24h. It ranks 86th by market cap.
Metric | Value |
Price | $0.1343 |
24h change | +0.35% |
Market cap rank | 86th |
Market cap | $387.02M |
FDV | $1.34B |
24h volume | $21.67M |
Volume to market cap | 5.59% |
Circulating supply | 2.87B of 10B |
Source: CoinMarketCap, KITE market data table, captured Nov 21, 2026, 11:42 UTC
Does KITE Holder Concentration Raise the Risk Around Support?
Etherscan holder data puts the top 100 wallets at 92.51% of the tracked base.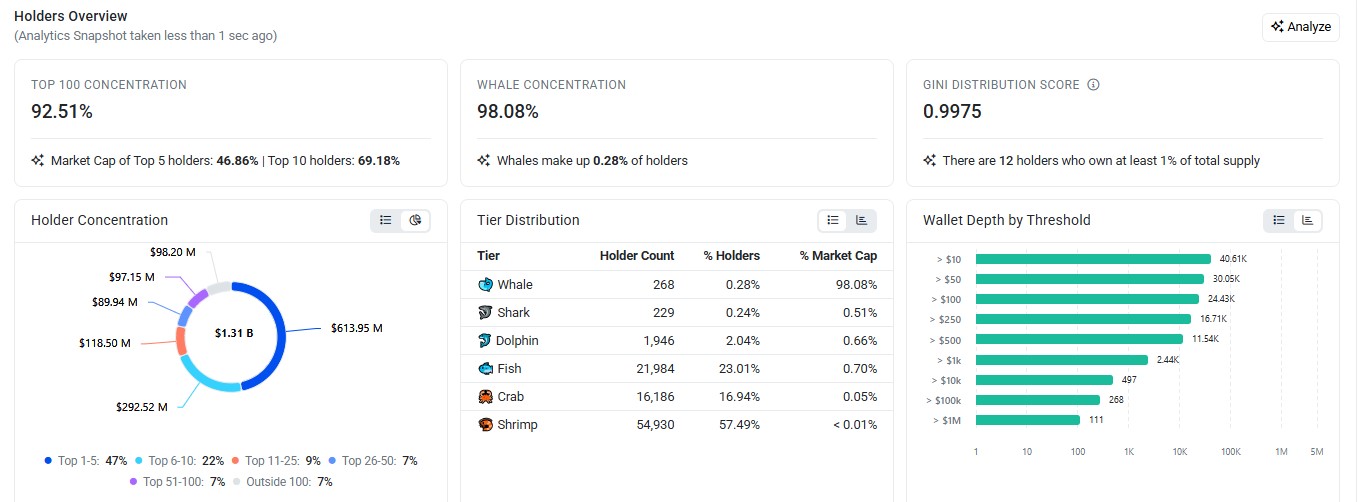
Source: Etherscan holder data, KITE holders overview, captured Nov 21, 2026, 11:42 UTC
The top 5 holders own 46.86%, and the top 10 reach 69.18%. Twelve holders each own at least 1% of supply.
Whales, meaning wallets with very large balances, number 268 and hold 98.08%.
The tracker's $1.31B total doesn't match the $387.02M market cap.
That level of KITE holder concentration leaves the price exposed to a few wallets. A large transfer to an exchange could add sell pressure near the $0.1309 support level.
What Is KITE Open Interest Telling Traders About Positioning?
Open interest is the total value of futures contracts still open, a gauge of positions traders are holding. CoinGlass futures data puts the total near $49M across all exchanges.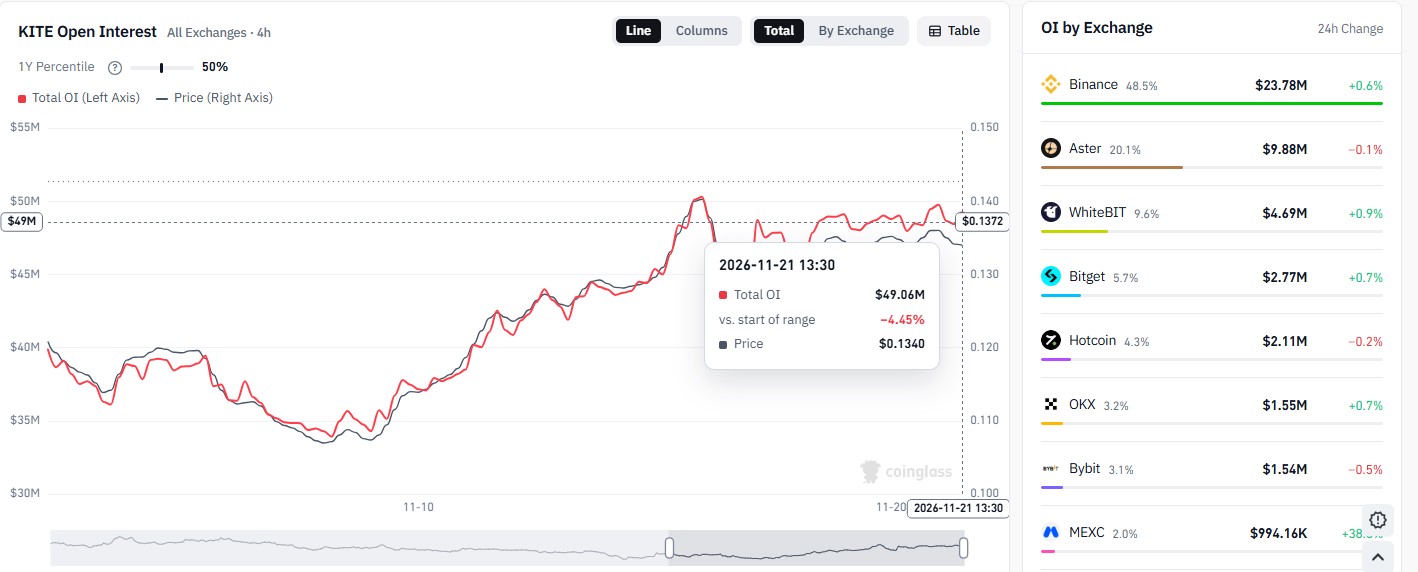
Source: CoinGlass data, KITE open interest all exchanges 4h, captured Nov 21, 2026, 11:42 UTC
Total open interest climbed from about $34M to a peak near $50M as price recovered. It has since flattened under the $0.1388 resistance level.
Binance holds $23.78M of it, a 48.5% share.
Traders added positions during the climb. For this KITE price prediction, positioning is crowded but undecided, so a daily break of $0.1309 or $0.1388 could trigger forced exits.
KITE Technical Analysis: Ascending Channel and MACD Levels
The TradingView KITE/USDT chart on Binance, set to the 4H timeframe, frames this KITE price prediction.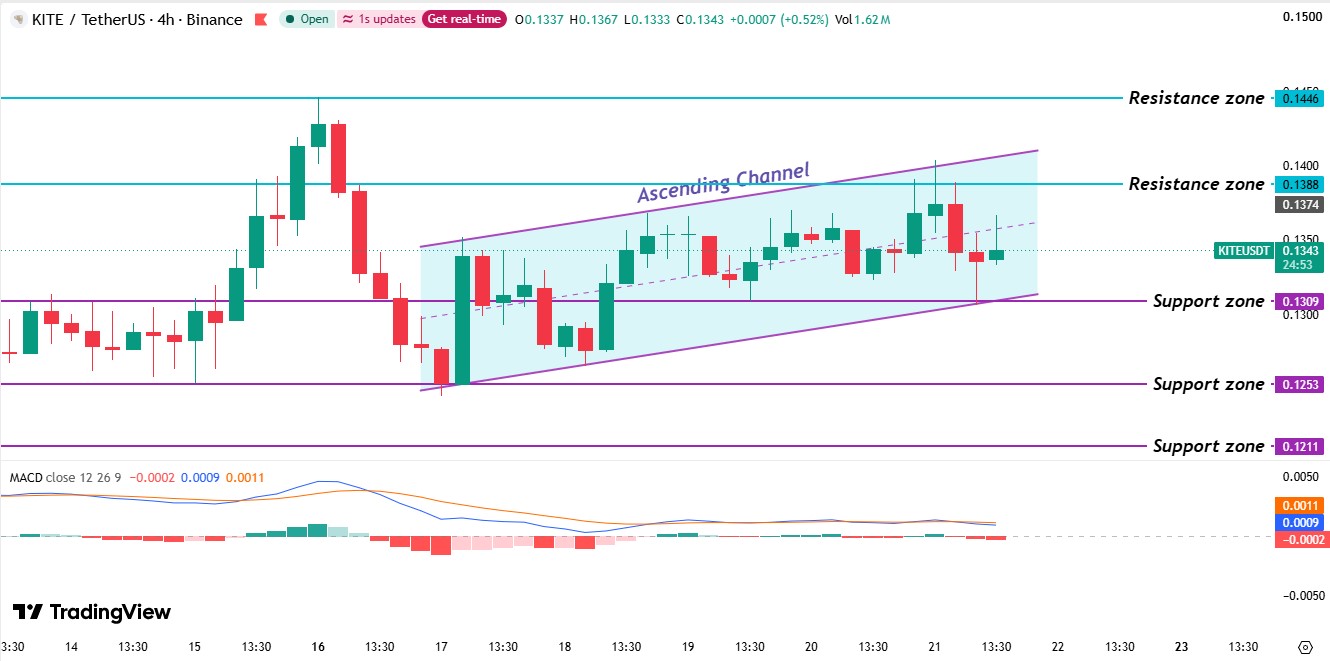
Source: TradingView, KITE/USDT 4H chart with MACD shown, captured Nov 21, 2026, 11:42 UTC
Price first moved in a range, a band held between a support level at $0.1253 and a resistance level at $0.1309. A climb through $0.1309 turned that old resistance level into a support level, and the rally ran to the resistance level at $0.1446.
Sellers reversed it, and a wick dipped under $0.1253 before buyers stepped in. Inside the channel, the market tried the $0.1388 resistance level several times and failed. One spike wick pushed above it and got rejected too.
The latest red candle wicked down to the $0.1309 support level, and buyers pushed the price back up. An ascending channel is a pair of rising parallel lines that hold the price between them. A break above the upper line would extend the climb, while a break below the lower line would end it.
Right now, the price trades above the $0.1309 support level, below the $0.1388 resistance level, and inside the channel.
The KITE MACD line reads 0.0009 against a signal line of 0.0011. The histogram, which plots the gap between the two, sits at -0.0002.
Both lines remain above zero but far under their earlier peak, and the MACD line sits below the signal line. Momentum is cooling, and sellers hold a slight edge.
Support and Resistance Levels
Level | Type |
$0.1446 | Resistance level |
$0.1388 | Resistance level |
$0.1309 | Support level |
$0.1253 | Support level |
$0.1211 | Support level |
KITE Price Prediction: Bull, Base, and Bear Scenarios
Bull: A daily candle trading above $0.1388 targets $0.1446, and one back below it cancels the move. Rising open interest would back it.
Base: Price stays between $0.1309 and $0.1388 and trades sideways until a daily candle breaks either level.
Bear: A daily candle trading below $0.1309 targets $0.1253, and one back above it cancels the move. Falling open interest would signal exits.
Risks lean to the downside. Whale transfers could add sell pressure near $0.1309, and a daily break under the channel would cancel the bullish setup.
Expert Outlook: Which Level Decides the KITE Price Forecast?
According to CoinGabbar analysis, it leans cautious on this KITE price prediction. The $0.1388 resistance level has been rejected several times. MACD momentum is cooling, and twelve wallets each hold at least 1% of supply.
A daily candle above $0.1388 would flip that read toward $0.1446. The line to watch is $0.1309, because a daily candle trading below it turns the channel bearish and opens $0.1253.
Disclaimer: This article is for information only and isn't financial advice. Traders should do their own research and risk only what they can afford to lose.