Can ATLAS Perps Lift ZRO Past $1.65? LayerZero Price Prediction


Is $1.49 the floor for ZRO, or just a pause before sellers retest $1.36?
At 09:24 UTC on Nov 17, 2026, ZRO trades at $1.49, up 6.64% in 24 hours. This LayerZero price prediction stays bearish below $1.648, a resistance level, meaning an area where sellers have capped rallies before.
The earlier key levels after the rebound set the base, and this ZRO price forecast adds fresh volume and futures data.
ZRO Price Today and Market Data
CoinMarketCap data ranks LayerZero 73rd with a $606.26M market cap, up 6.87%.
Volume, meaning the value traded in 24 hours, hit $79.41M, up 24.16%. Circulating supply is 405.97M of 1B tokens.
At $1.49, ZRO price today sits 80.19% under its $7.53 peak from December 2024. Fully diluted value, which prices all 1B tokens at today's rate, is $1.49B.
Why Is ZRO Moving Today?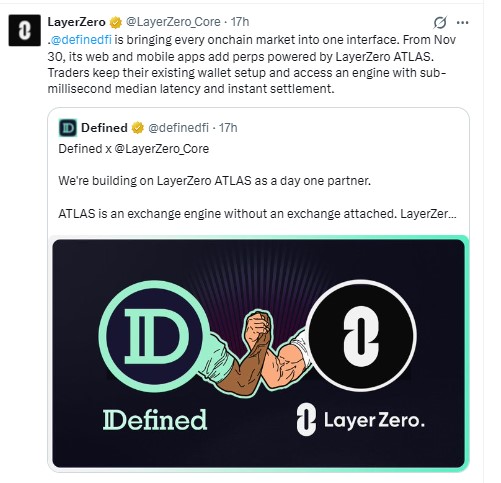
Fresh catalyst. LayerZero posted on X on Nov 16 that Defined, an on-chain trading app, adds perps from Nov 30. Perps are futures with no expiry. No launch hour has been given.
They run on LayerZero ATLAS, an exchange engine with no exchange attached. LayerZero says latency is sub-millisecond.
Price is up 6.64%. Volume jumped 24.16%. And futures volume rose 21.24% to $115.97M.
LayerZero Technical Analysis
ZRO Daily Chart Technical Analysis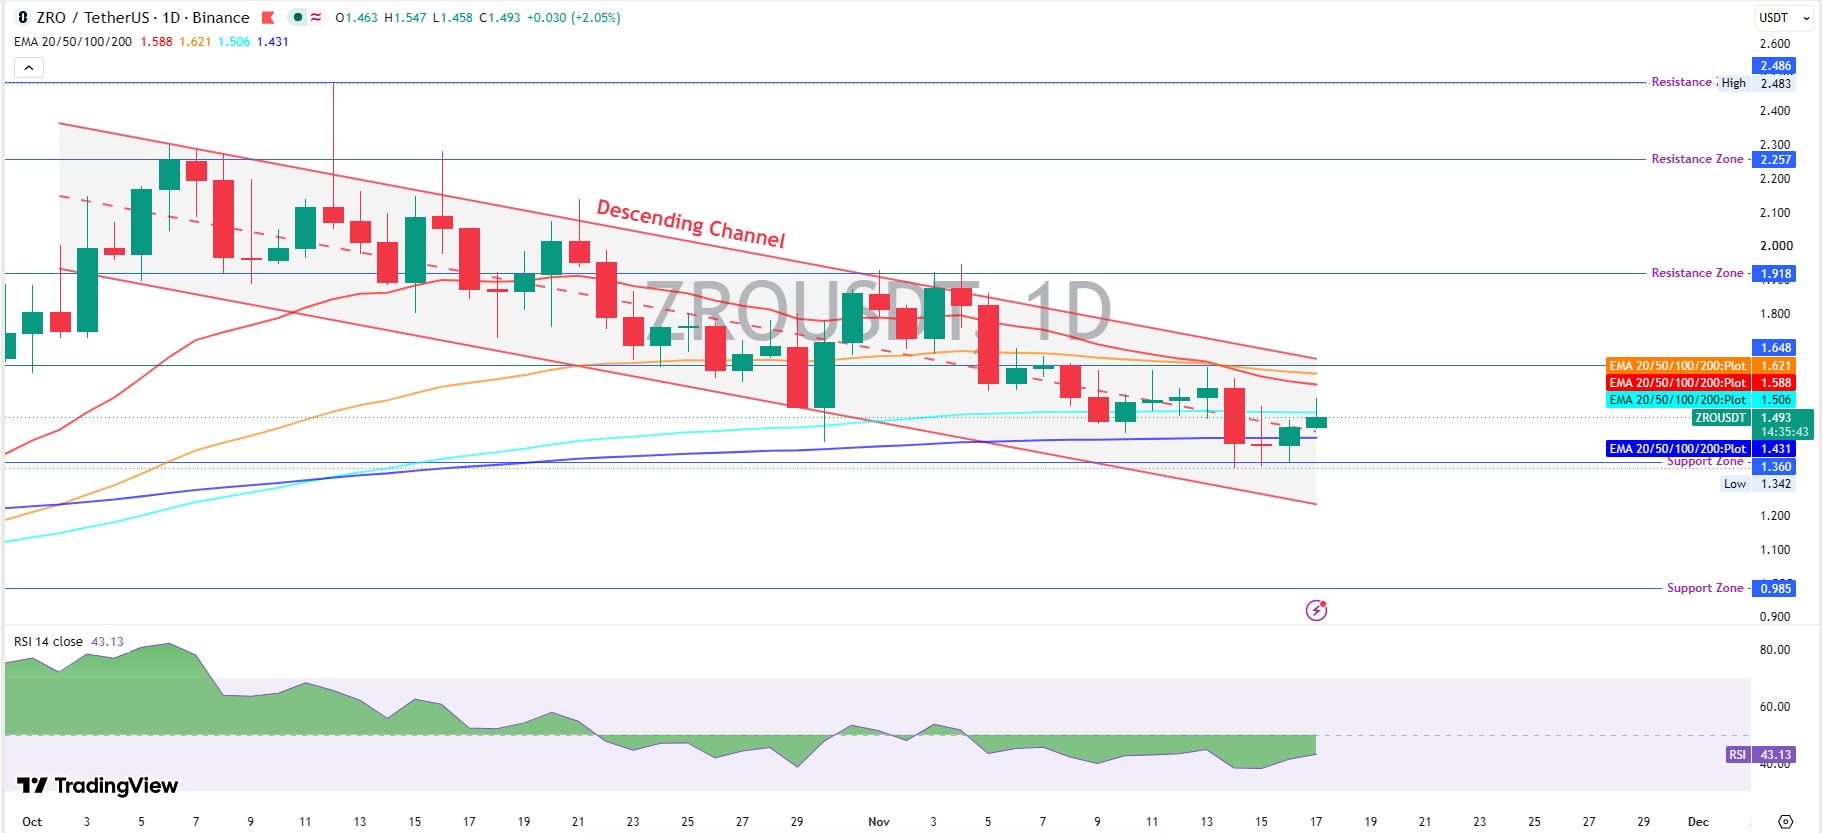
Early October brought a sharp run toward the $2.257 resistance zone. The daily candle that opened on Oct 12 then spiked to $2.483, and sellers took over.
Price slid down the channel after that. It lost the 50-day EMA at $1.621 and the 20-day EMA at $1.588, a bearish setup because the shorter average sits lower.
A long red candle that opened on Nov 14 sliced through the 100-day EMA at $1.506 and the 200-day EMA at $1.431.
Buyers stepped in at $1.36, a floor tested three times through the candle that opened on Nov 16. The low was $1.342.
Today's candle, opening, started at $1.463, hit $1.547, and traded at $1.493. Right under the 100-day EMA at $1.506. That's the lid for now.
Daily RSI is 43.13, under the 50 midline, so sellers still clearly hold the edge in this ZRO technical analysis. Compare it with the November 2026 LayerZero levels.
ZRO Weekly Chart Technical Analysis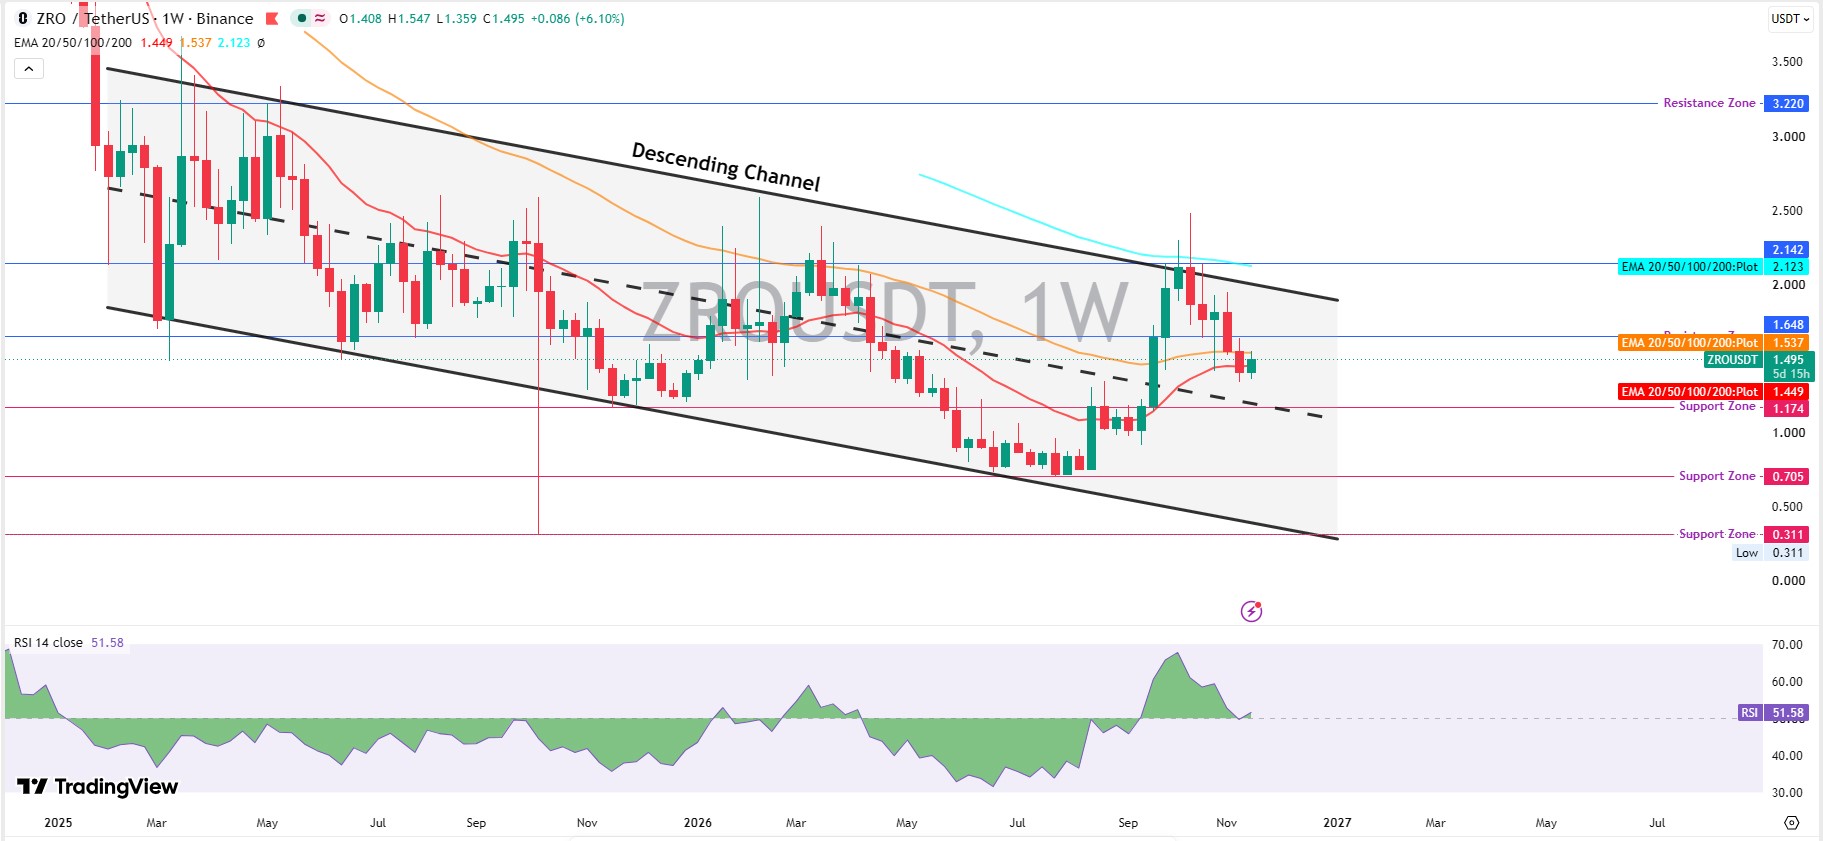
TradingView charts show ZRO starting 2025 above $3.50 and sliding inside a descending channel, a pair of falling trendlines drawn across highs and lows. Rallies kept stalling near the upper line.
Sellers pushed the price to $0.707 in late July 2026, right on the $0.705 support zone, where buyers have stepped in before.
A big green weekly candle lifted the price off that floor. By October it hit the upper trendline and the 100-week EMA at $2.123, a moving average that weighs recent prices more.
But buyers couldn't hold it. A spike to $2.483 failed, and weekly RSI slid from near 68 to 51.58.
Price now trades at $1.495 between the 20-week EMA at $1.449 and the 50-week EMA at $1.537.
ZRO Futures and Open Interest Data
CoinGlass futures data puts open interest, the total value of open contracts, at $146.82M, up 2.23%.
Futures volume is $115.97M, 4.4 times spot volume. Derivatives traders are driving this bounce.
So who's leading the buying?
Hyperliquid holds the biggest pool at $40.00M and took in $2.92M of net futures inflow. WhiteBIT lost $2.01M.
And the funding rate, a small fee longs and shorts pay each other, is 0.0075%. That's mild.
Liquidations, meaning forced exits of leveraged trades, total just $66.62K, with $52.71K from shorts. That's no squeeze. The Fear and Greed index at 13 shows extreme fear.
$ZRO Holder Concentration on Etherscan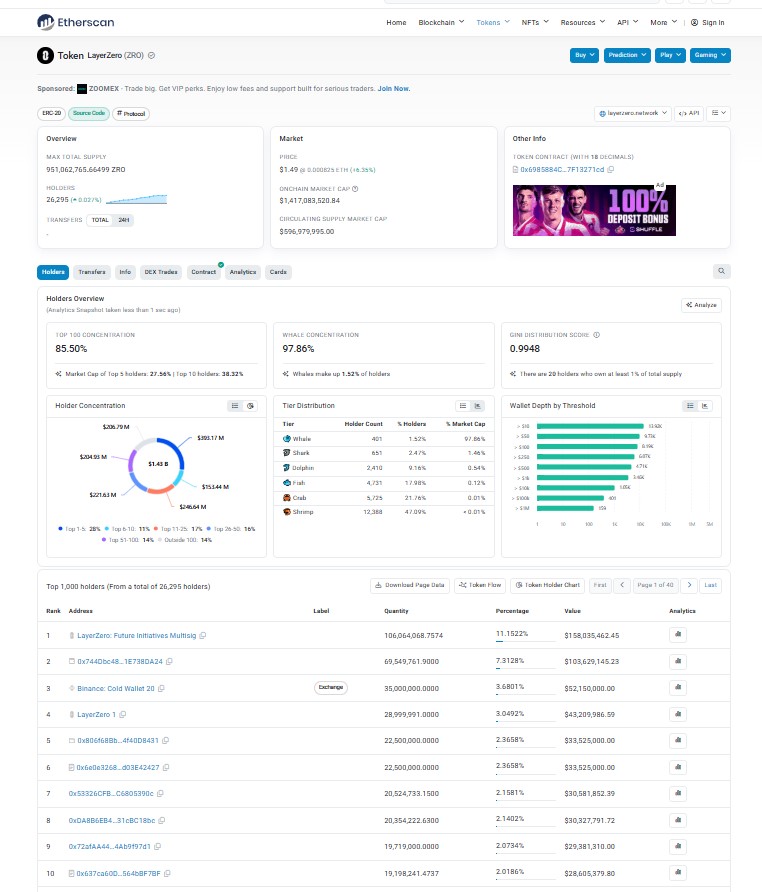
Etherscan token data shows the top 10 holders own 38.32% of supply and the top 100 own 85.50%.
LayerZero Future Initiatives Multisig holds 106.06M ZRO, or 11.15%. Whales, meaning wallets with very large balances, hold 97.86% of market cap.
LayerZero Price Prediction Scenarios for 30 Days
The base case is a range between $1.36 and $1.648, and every target below comes from chart levels, not a promise.
Scenario | Trigger | Target | Invalidation | Liquidity Condition |
Bull | Daily trade above $1.648 | $1.918, then $2.257 | Back below $1.621 | Volume above $79.41M, open interest rising |
Base | Hold between $1.36 and $1.648 | Range of $1.43 to $1.65 | Daily trade outside the range | Volume near $79M, thin spot flow |
Bear | Daily trade below $1.36 | $1.174, then $0.985 | Back above $1.506 | Sell volume spike, longs liquidated |
Above $1.648 on a daily basis. That flips the short-term bias. But exchange news can move liquidity fast, so crypto exchange listing updates belong on the watchlist.
Can ZRO Reach $2? Key Levels to Watch
Reaching $2 needs a 34% gain from $1.49. That means clearing $1.648 and $1.918 first, then the $2.142 channel top.
Support sits at $1.36 and $0.985 on the daily chart, with $1.174 and $0.705 on the weekly.
Breakout confirmation is a daily trade above $1.648 on volume over $79.41M. Breakdown risk starts under $1.36. Any LayerZero price prediction comes down to both lines. Compare other token setups for context.
Risks to the $ZRO Setup
Supply is the first risk. Only 405.97M of 1B tokens circulate, so 594.03M sit outside the market.
Concentration is next, since the top 100 wallets hold 85.50%.
A defined launch delay would remove the main catalyst. And a weaker market would hit $ZRO too, which memecoin crypto news tracks across smaller tokens.
Final Call on $ZRO
The trend is down. This bounce is real. But $1.648 decides whether it lasts.
Hold $1.36, and buyers get a shot at $1.918. Lose it and $1.174 comes first. Traders wanting a wider market view can scan AI crypto news for other setups.
Disclaimer. This article is for information only and isn't financial advice. Crypto is volatile, and no price or level is guaranteed. Always do independent research before trading.