Lighter Price Prediction November 2026: Can LIT Reclaim $5.4721?


Is Lighter going to reclaim $5.4721, or slide back to $3.0011?
The Lighter Price Prediction November 2026 comes down to one test. just under its 50-day EMA. For wider context, see the latest crypto market news.
Lighter 24-Hour Market Snapshot
CoinGecko market data captured Nov 04, 2026, 09:00 UTC. FDV is the value of every token in the total supply traded at today's price.
Metric | Value |
Price | $3.33 |
24h range | $3.04 to $3.45 |
Market cap | $828.088M |
FDV | $3.252B |
24h volume | $135.981M |
Total value locked | $790.296M |
Circulating supply | 250M |
Total supply | 981.909M |
Perps open interest | $515.408M |
Source: CoinGecko, Nov 04, 2026, 09:00 UTC
Only 250M of 981.909M tokens circulate, so most of the supply hasn't reached the market yet.
LIT Price Performance Against the Range
LIT trades 8.88% above its $3.04 24h low. It sits 4.06% below the $3.45 high.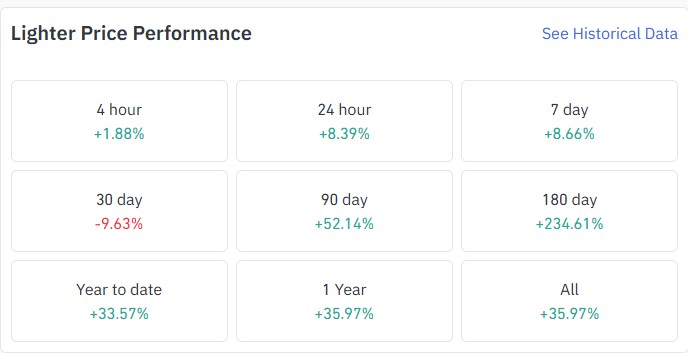
Source: CoinGlass, Nov 04, 2026, 09:00 UTC
CoinGlass price performance data shows a 24-hour gain of 8.39%. That reads as strength. On second thought, one green day proves little against a 9.63% monthly drop. Earlier coverage of the Lighter new all-time high gives context for that run.
Lighter Holder Concentration and Whale Wallets
Etherscan holder data, captured Nov 04, 2026, 09:00 UTC, puts holder concentration in the top 100 wallets at 93.14%. The whale tier, 417 large wallets, holds 99.28% of market cap.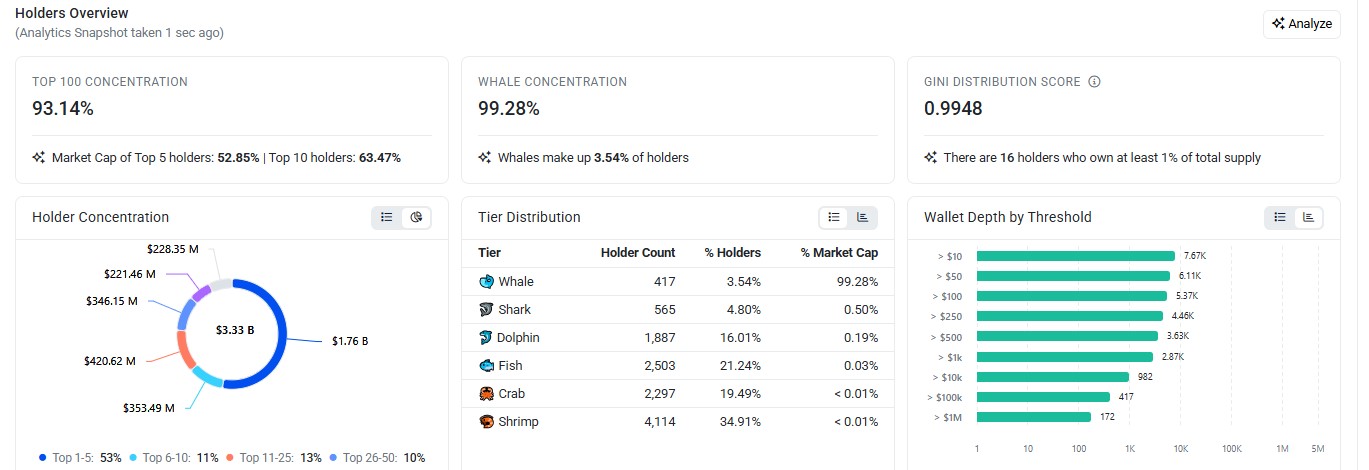
Source: Etherscan, Nov 04, 2026, 09:00 UTC
The Gini score, a 0 to 1 inequality measure, reads 0.9948. And sixteen wallets own at least 1% of the supply each.
The largest wallet holds 23.1809% of supply. The labeled ZkLighter address holds 14.4186%.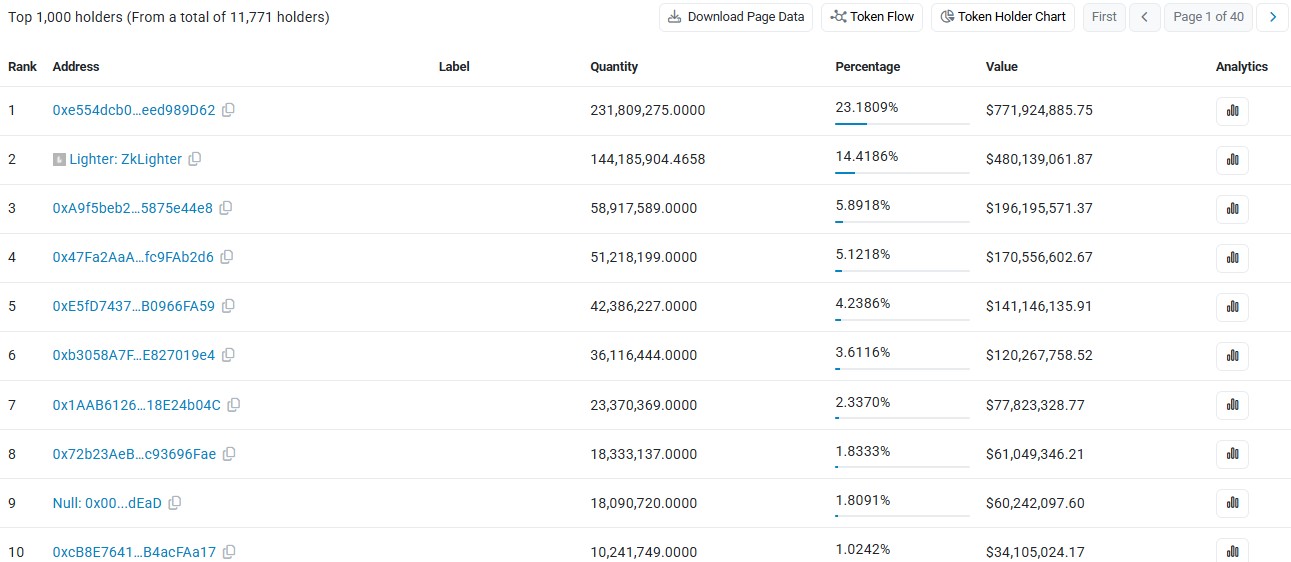
Source: Etherscan, Nov 04, 2026, 09:00 UTC
The top five whale wallets hold 52.85%, and the top 10 hold 63.47%. Rank nine is a labeled dead address with 1.8091% tokens no one can spend. Labeled addresses may be contracts, not traders.
LIT Liquidation Data
Shorts got squeezed. CoinGlass liquidation data, captured Nov 04, 2026, 09:00 UTC, shows $834.79K liquidated over 24h.
A liquidation is an exchange forcing a trader out of a borrowed-money bet. Shorts lost $520.15K. Longs lost $314.65K. But the last 12 hours flipped, with longs down $197.75K against $109.20K for shorts. Over 4 hours, shorts lost $61.19K and longs only $577.35.
Lighter Futures Volume and Open Interest
Open interest, the value of futures contracts still open, stands at $515.408M, per CoinGecko on November 04, 2026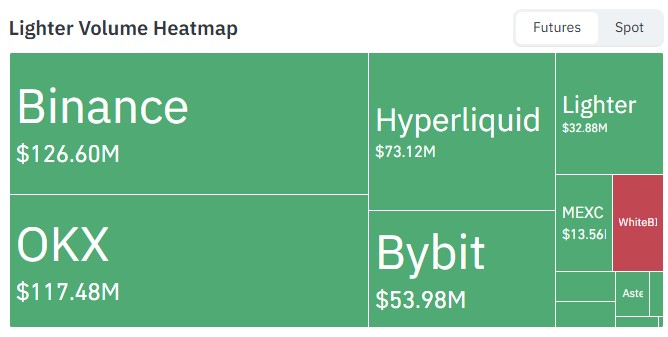
Source: CoinGlass, Nov 04, 2026, 09:00 UTC
CoinGlass futures Data ranks Binance at $126.60M. OKX follows at $117.48M, Hyperliquid trades $73.12M, and Bybit trades $53.98M.
Lighter Technical Analysis: 50-Day EMA and RSI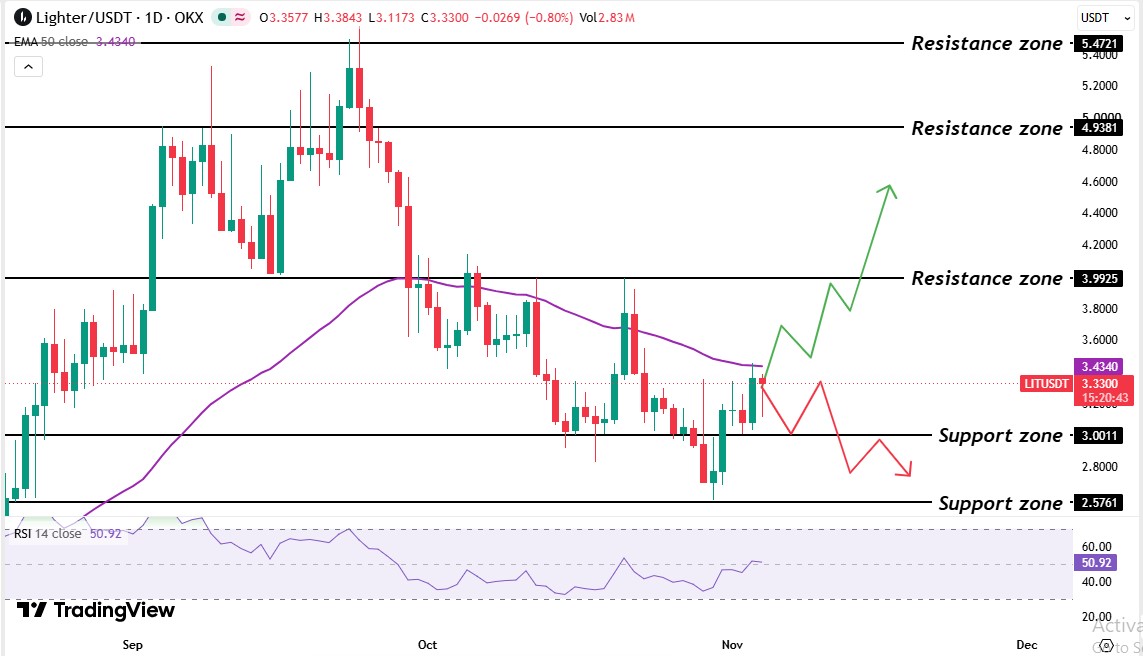
Source: TradingView, LIT/USDT 1D, Nov 04, 2026, 09:00 UTC
The OKX daily chart for LIT/USDT, frames this Lighter Price Prediction November 2026. A sharp September rally spiked to the $5.4721 level before sellers took control.
Price slid through the $3.9925 resistance zone, where sellers have capped rallies. The market tried many times to hold above the 50 EMA level through October, but sellers defended that level.
Price then settled near the $3.0011 support zone, where buyers have held that support.
Right now, LIT trades above the $3.0011 support, below the 50 EMA level and under the $3.9925 resistance. For the prior setup, see the LIT channel and derivatives study.
The LIT 50-day EMA sits at $3.4340, and LIT's $3.33 price trades 3.61% below it. The latest daily candle, one bar covering a day of trading, trades below the line too. So a real recovery needs a daily candle above it.
The LIT RSI reads 50.92 on the 14-day setting. Above 50, buyers hold the momentum edge, and 50.92 barely clears that. A reading above 30 means oversold conditions haven't formed, so the price has room to fall.
LIT Support and Resistance Levels
Level | Role |
$5.4721 | Resistance |
$4.9381 | Resistance |
$3.9925 | Resistance |
$3.4340 | 50-day EMA |
$3.0011 | Support |
$2.5761 | Support |
Lighter Price Forecast: Bull, Base, and Bear Scenarios
Scenario | Trigger | Target | Invalidation |
Bull | Daily candle above the $3.4340 EMA level | $3.9925 | Back under $3.4340 level |
Base | Range holds | $3.0011 to $3.4340 | Break of either edge |
Bear | Daily candle below $3.0011 | $2.5761 | Reclaims $3.0011 |
Bulls need to break the 50 EMA level first. Bears need support levels to fail.
Lighter Price Prediction November 2026: Expert Outlook
As per CoinGabbar analysis, the Lighter Price Prediction November 2026 carries a mild bearish tilt while the daily candle trades under the $3.4340 50 EMA level. The $3.33 price sits 3.61% below that line, and A 30-day change is -9.63%. The RSI at 50.92 shows little momentum. A daily candle trading under $3.0011 would confirm sellers hold control.
YMYL Disclaimer: This article is for informational and educational purposes only and should not be taken as financial or investment advice. Crypto markets are volatile.