Litecoin Price Prediction November 2026: Can LTC Hold $53.77?


Will Litecoin hold the $53.77 support level in November or slide toward $47.56?
This Litecoin price prediction reads CoinGecko, CoinGlass, SoSoValue, and chart data as of Nov 3, 2026. The Litecoin November price targets page adds the wider view.
LTC Price 24-Hour Market Snapshot
Metric | Value |
Price | $54.28 |
24h change | -1.1% |
24h range | $53.50 to $55.21 |
Market cap | $4.222B |
Fully diluted valuation (FDV) | $4.222B |
24h trading volume | $157.959M |
Source: CoinGecko, captured at 11:30 am UTC on Nov 3, 2026.
Per CoinGecko market data as of Nov 3, 2026, UTC, FDV, the coin's value if every future coin existed, matches the market cap. No hidden supply weighs on the price. Only 6.213M LTC remain before the 84M cap.
Litecoin Support Levels and 24h Price Performance
LTC trades at $54.28, down 1.1% on the day. The day's low is $53.50, and the high is $55.21. Against BTC, LTC slipped only 0.2%, so most of the dip matches a softer market, not Litecoin alone.
Traders call a level where buyers step in support and a level where sellers step in resistance. The day's low of $53.50 sits just under the $53.77 chart support. These Litecoin support levels frame the whole month.
Litecoin ETF Flows From the Canary LTCC Fund
SoSoValue ETF data lists one US spot Litecoin ETF, Canary's LTCC on Nasdaq. Daily net inflow, the money entering minus money leaving, was $0.00. Cumulative net inflow stands at $16.61M.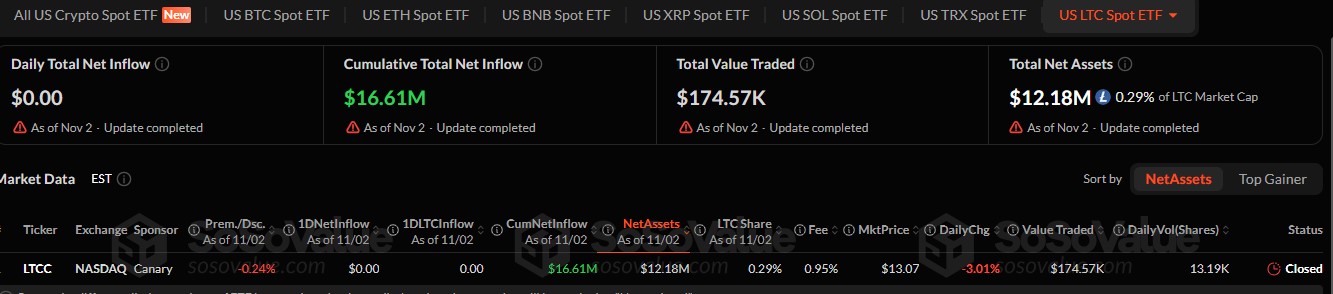
Source: SoSoValue US LTC spot ETF data, captured 11:30 am UTC.
ETF net assets, the total value of coins the fund holds, came to $12.18M, or 0.29% of LTC's market cap. Shares fell 3.01% on the day.
Net assets sit $4.43M below cumulative inflows, so Litecoin ETF flows fit a falling LTC price. And $0.00 of daily flow means the fund isn't adding buyers.
Litecoin Liquidation Data Shows Longs Hit
Longs took the hit. In the last 24h, liquidations reached $600.09K, per CoinGlass liquidation data as of Nov 3, 2026. A liquidation happens when an exchange shuts a trade by force after losses use up its borrowed funds.
Longs, bets on a rise, lost $544.51K of that. Shorts, bets on a drop, lost $55.58K. About 95% of the total hit before the last 12 hours.
The last 12 hours evened out. Longs lost $16.86K and shorts lost $15.58K. Then the pace slowed. Only $1.22K in the last hour, all from shorts.
Litecoin Open Interest and Futures Volume
Open interest is the total value of futures contracts still open. Perps, futures with no expiry date, carry $617.883M of it, per CoinGecko. That equals 14.6% of the $4.222B market cap.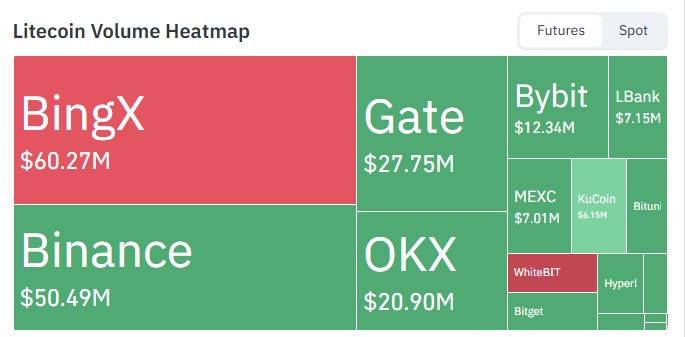
Source: CoinGlass LTC futures volume heatmap, captured 11:30 am UTC on Nov 3, 2026.
The CoinGlass volume heatmap as of Nov 3, 2026, ranks BingX first at $60.27M. Binance follows at $50.49M, a gap of $9.78M. BingX alone traded more than Gate and OKX combined. The top two handled $110.76M, so their order books set the pace.
Litecoin Technical Analysis: 50-Day EMA and RSI
The Litecoin price prediction chart uses Bitstamp LTC/USD on the 1D timeframe in TradingView, captured around 11:27 UTC on Nov 3, 2026. LTC first moved sideways near $50 for weeks, then surged to about $79 in late September.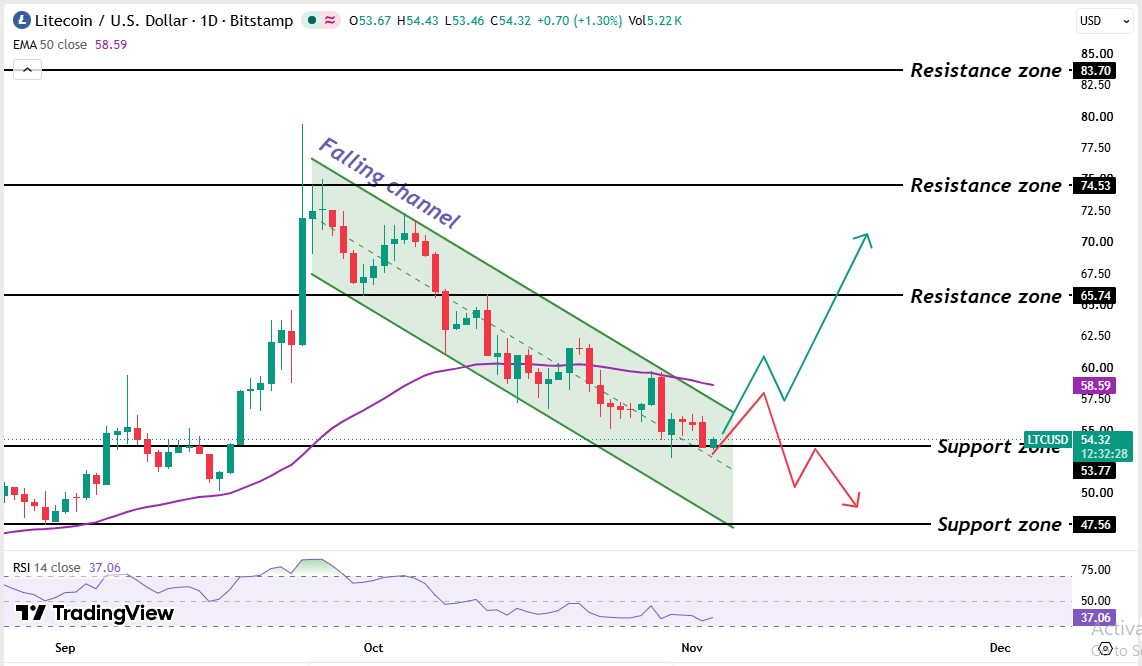
Source: TradingView Bitstamp LTC/USD 1D chart, captured around 11:27 UTC on Nov 3, 2026.
That spike set the top of a falling channel, two sloping lines that hold price in a downward lane. Lower highs and lower lows followed through October. The price fell to the $53.77 support.
The 50-day EMA sits at $58.59. Price trades 7.4%, below it. A 7.9% rise is needed to reach it. And because the EMA is sloping down, sellers keep control.
RSI reads 37.06. Under 50 means sellers hold momentum, and under 30 would mean oversold, so room to fall remains. For wider market moves, the latest crypto market news tracks the same weeks.
Litecoin Support and Resistance Levels
Level | Type |
$83.70 | Resistance |
$74.53 | Resistance |
$65.74 | Resistance |
$58.59 | 50-day EMA |
$53.77 | Support |
$47.56 | Support |
LTC Price Outlook: Bull, Base, and Bear Scenarios
Scenario | Trigger | Target | Invalidation |
Bull | Daily candle above the $58.59 level | $65.74 than $74.53 | Daily candle below $58.59 |
Base | Price holds $53.77 to $58.59 | $58.59 | Daily candle outside the range |
Bear | Daily candle below $53.77 | $47.56 | Daily candle above $58.59 |
In the Litecoin price prediction scenarios, bulls need to reclaim the $58.59 50 EMA level first. Bears need one daily candle below $53.77. A regulatory delay slows any new Litecoin ETF product. An ETF flow reversal shows as net outflows after $16.61M of cumulative inflow. A technical invalidation is a daily candle against a scenario's trigger.
Litecoin Price Prediction Expert Outlook
As per CoinGabbar analysis, Bears holds the edge in the Litecoin price prediction view. Price trades $4.31 below the 50-day EMA. Longs made up 91% of 24-hour liquidations. But the $53.77 floor is only $0.51 away and still holds.
since 1H liquidations cooled to $1.22K. Open interest is the number to monitor. If it falls below $617.883M while the daily candle trades above $53.77, forced selling has run its course.
YMYL Disclaimer: This article is for informational and educational purposes only and should not be taken as financial or investment advice. Crypto markets are volatile, and details such as prices mentioned here can change over time. Readers should do their own research before making any decisions based on this content.