MIHAO Price Prediction: Can Ni Hao Cat Hold $0.0090 Support?


Can a token up 3,500% in a day hold even half of it?
That's the question around the ni hao cat token, and a fair MIHAO price prediction has to start with how thin the buying cushion is. Traders who follow meme coin news know the pattern.
MIHAO Price Prediction Data Snapshot
Price, Range, and Volume
$0.01389 is where MIHAO trades on ni hao cat data, up 3,539.8% in 24 hours. The range ran from $0.0001432 to $0.0154.
Market cap is $14.465M, equal to fully diluted value since all 1B tokens circulate. Volume across venues came to $7.678M.
The 6h gain is 87.82%, yet the last hour is down 4.22%.
Pool and Trade Flow
On the live pool chart, liquidity sits at $310.4K and 24-hour volume at $850.67K. It counts a single pool, so it's lower than the $7.678M above.
Buys beat sells 926 to 363, and net buying reached +$131.34K. Decent demand.
But $310.4K backing a $14.465M cap means MIHAO liquidity covers about 2.1% of market value. A few $40K sellers would move the price fast.
Why Is Ni Hao Cat Moving? Moonshot and KCEX Posts
Moonshot Verification
Verification on a retail trading app opens a token to a wider crowd, and the Moonshot verification post came early in the token's life.
Price couldn't hold, though. The first peaks all failed between $0.025 and $0.030.
KCEX Spot Listing
Spot trading opened. MIHAO/USDT went live at 06:30 UTC on Nov 15. Withdrawals followed on Nov 16.
The KCEX listing post promised zero spot fees. Price didn't react. The $0.03044 high had come hours earlier, and later peaks stayed under $0.02.
So the MIHAO KCEX listing wasn't the trigger for the current rally, which started days later.
MIHAO Technical Analysis: From Launch Spike to Breakout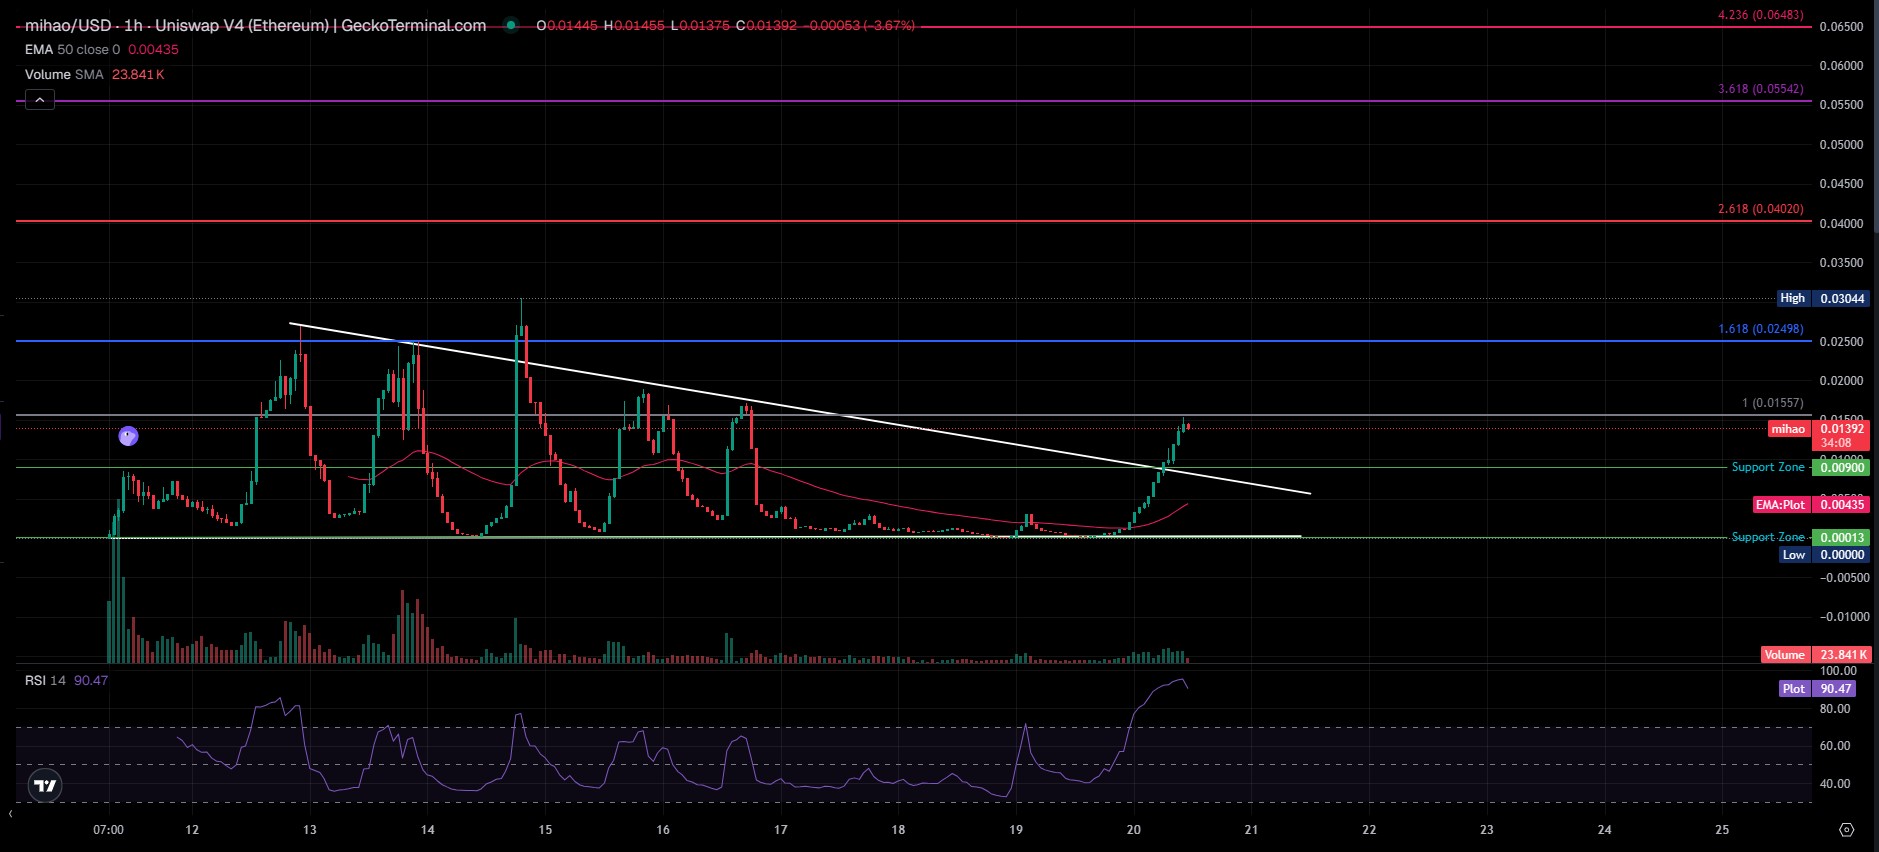
Launch Spike and Failed Rallies
The price opened near $0.012, drifted lower, and then ran to about $0.027 before sellers took over.
A second run reached about $0.025. Then came a spike to $0.03044, the highest point on this MIHAO price analysis chart.
Later rallies topped out lower, near $0.019 and then $0.017. A descending trendline, which is a line drawn through lower highs, connects them all.
Range at the Base
Price dropped to the $0.00013 floor and stayed near it for almost three days.
Volume sits far under the 23.841K volume SMA, the average volume over a set number of bars.
Trendline Break and EMA 50
Buyers returned late. Candles broke the trendline near $0.0090, marked on the chart as a support zone.
The EMA 50, an exponential moving average that weights recent hourly prices more, sits at $0.00435. Price trades more than 3 times above it, which is a wide gap.
The run topped out near the $0.01557 level. And the latest hourly candle opened at $0.01445 and traded at $0.01392, down 3.67%.
RSI and Volume
RSI sits at 90.47 on the 1h chart. Readings above 70 count as overbought.
That means strong buying. It also means a pullback is more likely, not guaranteed.
Volume on the breakout stayed far below the launch bursts. Weak confirmation.
Key MIHAO Support and Resistance Levels
MIHAO support and resistance levels come straight from the 1h chart.
Support
Every MIHAO price prediction needs a floor, and $0.0090 is it. Below that sits the EMA 50 at $0.00435, then the $0.00013 base.
Price leans bullish at $0.01392. Scratch that, it only leans bullish above $0.0090. An hourly trade under that level turns the setup bearish.
Resistance
$0.01557 is the first ceiling, the 1.0 Fibonacci level. Next is $0.02498, the 1.618 level, where an earlier rally stalled. And above it sits the $0.03044 high.
Fibonacci Extension Targets
MIHAO Fibonacci targets above the high are $0.04020, $0.05542, and $0.06483. A Fibonacci extension projects levels from an earlier swing.
They only matter after $0.03044 breaks on real volume.
MIHAO Price Prediction Scenarios
This Ni Hao Cat price prediction and MIHAO price forecast lean bullish above $0.0090. Readers can compare the setup with the latest price predictions for other tokens.
Scenario | Trigger | Target | Invalidation | Liquidity Condition |
Bull | Hourly hold above $0.01557 | $0.02498, then $0.03044 | Below $0.0090 | Volume above 23.841K SMA |
Base | Range trade | $0.0090 to $0.01557 | Break of either side | Flat volume |
Bear | Loss of $0.0090 | $0.00435 | Reclaim of $0.01557 | Sells outpace buys |
For 24 hours, a range between $0.0090 and $0.01557 is the likeliest path.
Can MIHAO reach $0.025? Only after $0.01557 holds on the hourly chart. Then $0.02498 becomes the target.
Over 30 days, a range from $0.00435 to $0.02498 is realistic.
Holder Cost Basis and Liquidity Risk
Early Buyer Profit
The MIHAO price prediction also depends on who holds supply. Tracker data shows top wallets paid $0.0001 to $0.0008 per token. Positions worth about $40K carry gains from 1,682% to 6,225%, and balances are public on Etherscan holder data.
Who sells first when a $40K position is up 5,000%?
A $310.4K pool can't absorb many of them.
Concentration
Holders fell from about 1.45K to 1,203 over the week, which usually means profit-taking. The top 10 wallets hold 4.80%, and the top 100 hold 23.73%. The Uniswap V4 pool manager holds 1.34%, and a single wallet holds 1.01%.
Traders who track wallets often pair that data with AI crypto news for context.
Risks That Could Change the MIHAO Price Prediction
Liquidity comes first. $310.4K of pool depth can't take large sells without a sharp drop.
RSI at 90.47 raises pullback odds, and a 9-day history gives little to lean on.
Volume sources disagree too, with $850.67K on the pool against $7.678M across venues. New venues add sell routes, so exchange listing updates matter for the next move.
Disclaimer: This article is for information only and isn't financial advice. Crypto prices are volatile, and new tokens carry extra risk from thin liquidity. Do your own research before trading.