NEAR Price Prediction: Can NEAR Inflation Cut Lift Past $3.462?


Can buyers clear the $3.462 resistance level, or does this NEAR price prediction turn bearish below $2.638?
This NEAR price prediction begins with NEAR trading well below its October highs. Sellers have controlled the slide since then, and traders comparing setups can review the previous NEAR forecast.
Buyers still need to clear a resistance level, where sellers have capped rallies, and defend a support level, where buyers have stepped in before.
Where Does NEAR Stand Right Now?
Metric | Value |
Price | $3.243 |
24h change | +3.02% |
Market cap | $4.28B |
Market cap rank | 19th |
FDV | $4.28B |
24h volume | $524M (+27.23%) |
Circulating supply | 1.31B NEAR |
Holders | 16.79K |
Source: CoinMarketCap, NEAR Protocol market snapshot, captured Nov 17, 2026, 06:04 UTC
fully diluted valuation, is the value of the full token supply at today's price. NEAR's FDV matches its market cap at $4.28B, but the max supply is unlimited, so new issuance keeps adding tokens.
Volume rose 27.23% with the bounce, which fits buyers stepping in.
What Does the NEAR Inflation Rate Cut Mean for Prices?
The NEAR inflation rate is the yearly pace of new tokens created. Per the official NEAR Protocol X post, House of Stake, the project's on-chain governance body, approved cutting maximum annual issuance from 2.5% to 1.6%. The post adds that the Security Council review has concluded.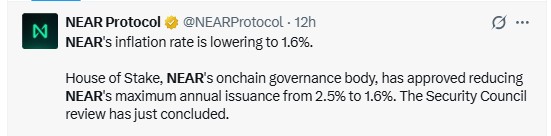
Source: NEAR Protocol on X, post captured Nov 17, 2026, 06:04 UTC (posted about 12h earlier)
Lower issuance means fewer new tokens reach the market. For traders who follow the latest crypto news, that trims one source of supply. If approval stands, buyers gain a reason to defend support. But if it stalls, price answers to the chart levels again.
Arthur Hayes (@CryptoHayes) posted price targets for four tokens, including NEAR, in a post on X.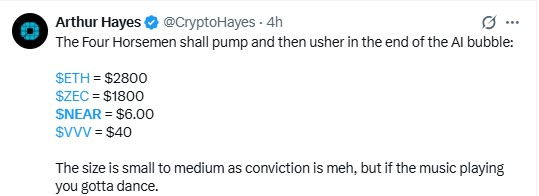
Source: Arthur Hayes (@CryptoHayes) on X, post captured Nov 17, 2026, 06:04 UTC
What Does NEAR Liquidation Data Show?
Liquidation is a forced exit from a borrowed-money trade once margin runs out. CoinGlass liquidation data shows $1.15M in NEAR liquidations over 24h.
Window | Longs | Shorts | Total |
1h | $107.43 | $14.61K | $14.72K |
4h | $15.55K | $333.41K | $348.96K |
12h | $65.35K | $351.18K | $416.53K |
24h | $503.56K | $647.12K | $1.15M |
Source: CoinGlass, NEAR liquidations, captured Nov 17, 2026, 06:04 UTC
Shorts are getting squeezed. A $333.41K hit in 4h. Over 12h, shorts lost $351.18K while longs lost $65.35K.
Shorts seemed to be the only side hurt. Make that two sides, since the 24h count shows longs lost $503.56K as well, and almost all of it hit before the last 12h. Shorts still led the day at $647.12K.
Short liquidations are forced buy orders, so trapped sellers added buy pressure in the last 12h. Can a market that squeezed $333.41K of shorts in 4h turn that into a real breakout? Another burst of long liquidations would add sell orders and test the $2.638 support level.
What Does the Chart Say About This NEAR Price Prediction?
The Binance 1D chart for NEAR/USDT on TradingView frames this NEAR price prediction. A sharp spike above the $5.911 resistance level faded fast, and sellers took control.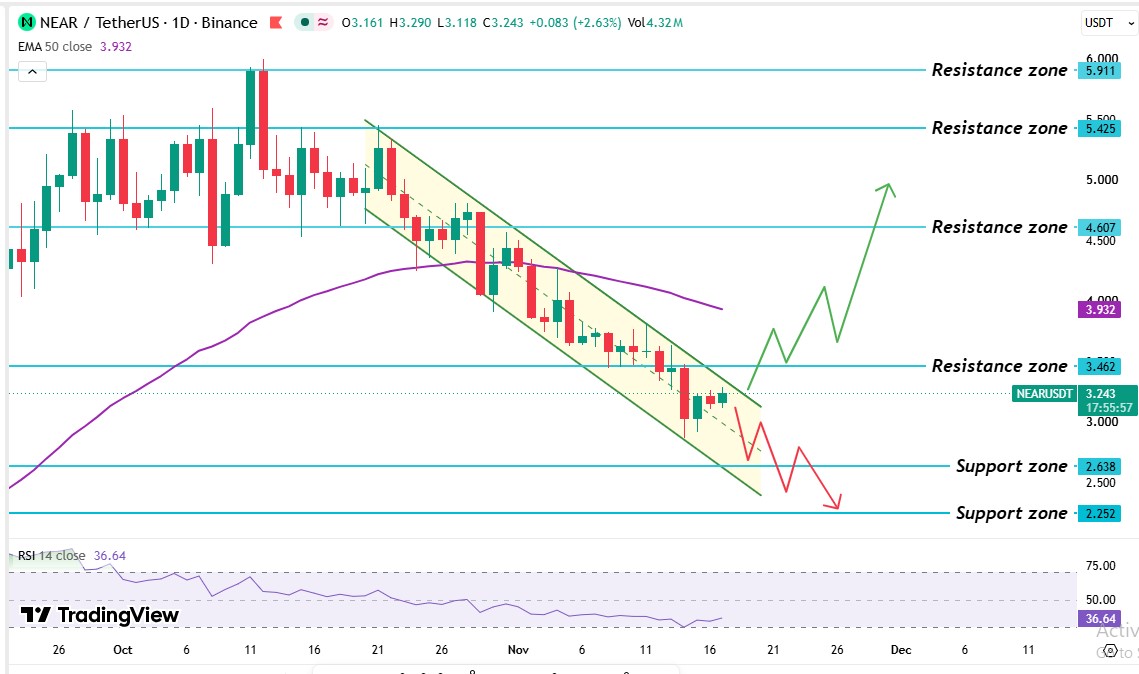
Source: TradingView, NEAR/USDT 1D chart on Binance with EMA 50 and RSI 14, captured Nov 17, 2026, 06:04 UTC
Buyers climbed from a support level at $4.607 and held a range, a band between that level and a resistance level at $5.425. Several tries at $5.425 failed, and one spike poked through $5.911 before sellers rejected it.
The break below $4.607 flipped that level, so what had been support became resistance. Price then lost the 50-day EMA, the average of the last 50 daily prices. The $3.462 level gave way next and now sits overhead as a resistance level.
The newest candles show a small recovery after a dip that stayed above the $2.638 support level. Price trades inside a falling channel, two parallel lines sloping down that box in lower highs and lower lows. A break above the upper line would signal sellers losing control, while a break below the lower line would open the way to $2.638. The earlier Talos intents breakout covered a different setup. Right now, the price sits above the $2.638 support level but below the $3.462 resistance level and the 50 EMA level.
The NEAR 50-day EMA sits at $3.932. NEAR's $3.243 price trades below it, and the EMA sits 20.6% above that price. The latest daily candle trades below the average too. But a recovery needs a candle above the channel's upper line, then $3.462 and the EMA.
The NEAR RSI reads 36.64 on the 14-day setting. It peaked above 70 at the start of October. Under 50 means sellers hold the edge, and above 50 means buyers do. Above 30 means oversold conditions haven't formed and the price has room to fall. Under 30 means selling has gone too far and a bounce is possible.
Support and Resistance Levels
Level | Type |
$5.911 | Resistance level |
$5.425 | Resistance level |
$4.607 | Resistance level |
$3.932 | 50-day EMA |
$3.462 | Resistance level |
$2.638 | Support level |
$2.252 | Support level |
Source: TradingView, NEAR/USDT 1D chart on Binance, captured Nov 17, 2026, 06:04 UTC
The nearest levels are $3.462 above price and $2.638 below it.
NEAR Price Forecast: Bull, Base, and Bear Scenarios
Scenario | Trigger | Target | Invalidation |
Bull | Daily candle trades above $3.462 | $3.932 50EMA level then $4.607 | Daily candle back below $3.462 |
Base | Price holds between $2.638 and $3.462 | Sideways trade inside the range | Daily candle breaks either level. |
Bear | Daily candle trades below $2.638 | $2.252 | Daily candle trades above $3.462 |
Governance news can fade quickly, and a delayed or reversed issuance change would remove that support. And a daily candle below $2.638 would end the base range.
Can NEAR Reach $6.00 From Here?
Per his X post, Arthur Hayes named $6.00 as the NEAR target and sized the trade small to medium. Reaching it needs an 84.0% gain from here. Buyers must clear the $3.462 resistance level first, then the 50-day EMA at $3.932.
From there, $4.607 and $5.425 stand in the way. The $5.911 resistance level sits just under the target, and the October peak topped out near $6.00.
What Is the Expert Outlook on NEAR Support Levels?
According to CoinGabbar analysis, the evidence leans bearish. Price trades 20.6% below the $3.932 EMA, the RSI reads 36.64, and the falling channel is intact. The inflation cut adds context, but Hayes sized his trade small to medium. That keeps this NEAR price prediction tilted toward a range with downside risk. A daily candle above $3.462 would be the first sign of a trend change. And a daily candle below $2.638 would confirm sellers still control the channel.
Disclaimer: This article is for information only and isn't financial advice. Traders should do their own research and risk only what they can afford to lose.