Official Trump Price Prediction: Can TRUMP Survive Probe News?


Can TRUMP defend the $1.166 support after a 21.66% weekly slide?
The Official Trump Price Prediction starts at a 21.66% dropdown in the week. TRUMP trades at $1.21 as of 04:30 UTC on Nov 6, 2026, after a probe headline hit the token.
TRUMP 24-Hour Market Snapshot:
Metric | Value |
Price | $1.21 |
Rank | 122th |
24h range | $1.12 to $1.29 |
Market cap | $342.239M |
FDV | $1.214B |
24h volume | $314.1M |
Circulating supply | 281.868M |
Max supply | 1B |
Source: CoinGecko market data, November 6, 2026, 04:30 UTC
FDV is the token value if all 1B tokens are already circulated. Only 28.2% trades today, so new releases can cap rallies.
TRUMP News: Congress Probe Headline Rattles the Token
A congressional probe is a formal inquiry that can demand documents and testimony. Per the Watcher.Guru X post dated Nov 5, 2026 UTC, Democrats are preparing to investigate President Trump's crypto ventures 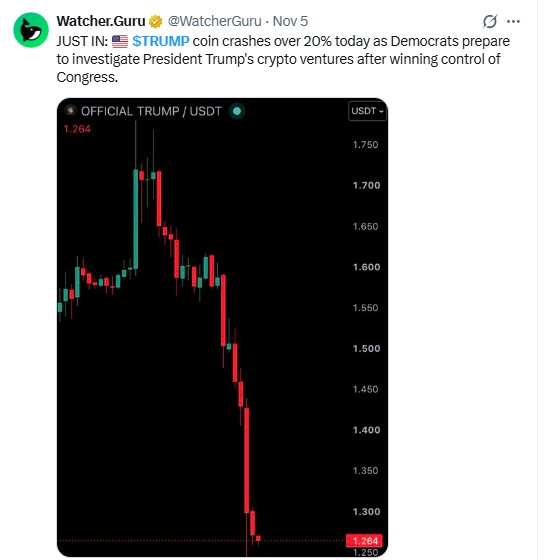
Source: Watcher.Guru on X, Nov 5, 2026 UTC, captured Nov 6, 2026, 04:30 UTC
The post says TRUMP crashed more than 20% that day. If subpoenas follow, sellers keep pressing $1.166. If not, the shock can fade, since the price already fell in seven days. This TRUMP news is one day old, and the drop already sits on the chart.
TRUMP Price Forecast Clues: One Rough Week in Numbers
CoinGlass price performance data, captured at 04:30 UTC on Nov 6, 2026, shows TRUMP up 2.35% over 4 hours. But the 24h change is -2.87%, and the 7d change is -21.66%.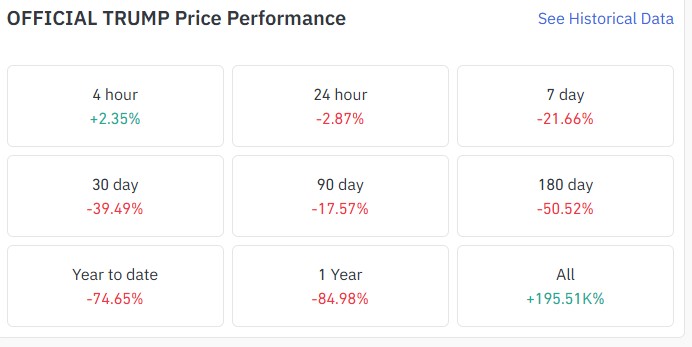
Source: CoinGlass, Official Trump price performance, Nov 6, 2026, 04:30 UTC
Working back from the 7d move puts the price near $1.54 a week ago, while the latest crypto market news covers the wider market backdrop. Holders stuck in losses often sell into bounces.
TRUMP Support Levels and Whale Risk: One Wallet Holds 71.81%
Solscan holder data, captured at 04:30 UTC on Nov 6, 2026, shows the top 10 wallets own 88.51% of the supply.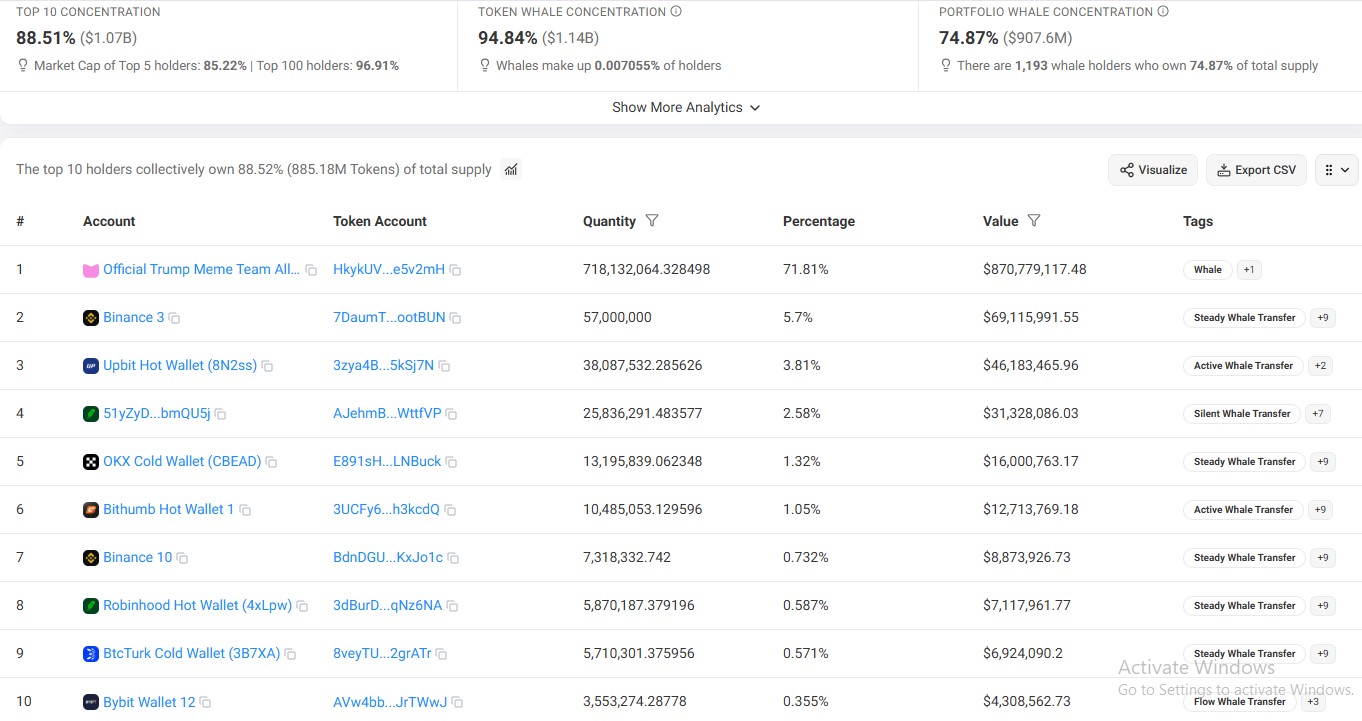
Source: Solscan, Official Trump token holders, Nov 6, 2026, 04:30 UTC
A whale is a wallet holding a very large share of supply. The top wallet, labeled Official Trump Meme Team, holds 71.81%. With TRUMP whale concentration this high, TRUMP support levels can fail fast when one seller moves.
TRUMP Liquidation Data: Shorts Took the Hit in 12 Hours
CoinGlass TRUMP liquidation data, captured at 04:30 UTC on Nov 6, 2026, shows $8.06M liquidated in 24 hours.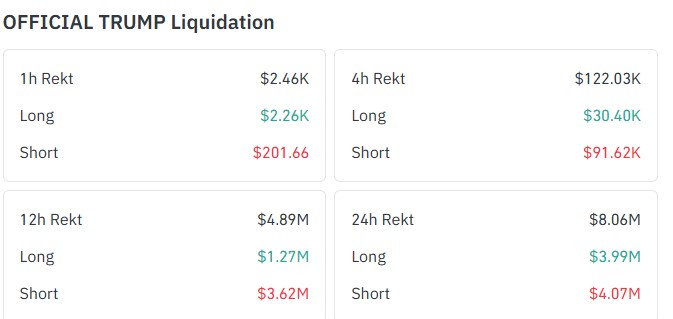
Source: CoinGlass, Official Trump liquidation data, Nov 6, 2026, 04:30 UTC
Shorts got burned. In 12 hours, liquidations reached $4.89M, and shorts lost $3.62M.
A liquidation means an exchange forces a leveraged trade to end when margin runs out. Short liquidations force buying, which can fuel sharp bounces. But the pace has cooled. Only $122.03K liquidated in four hours.
TRUMP Open Interest: Futures Bets Sank From the October Peak
Open interest is the total value of futures contracts that remain active. CoinGlass open interest data, captured at 04:30 UTC on Nov 6, 2026, reads $161.40M.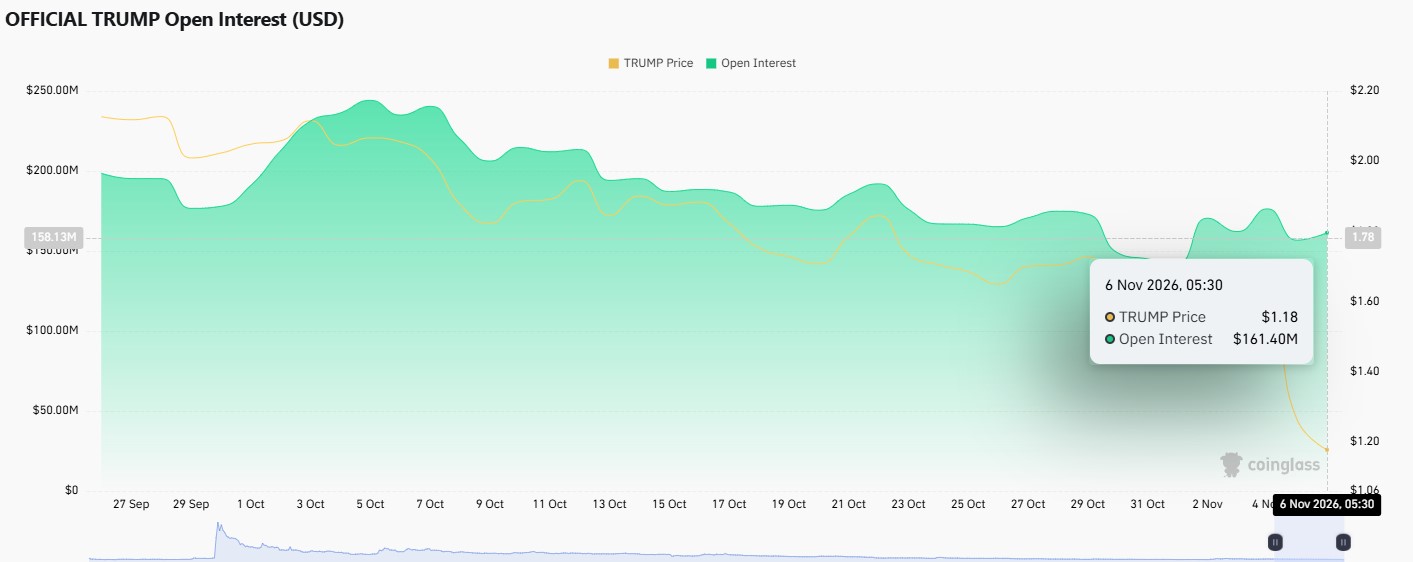
Source: CoinGlass, Official Trump open interest in USD, Nov 6, 2026, 04:30 UTC
The chart shows a peak near $245M on Oct 5, so the drop is about 34%. Fewer open bets mean smaller forced moves but less rally fuel.
Dividing FDV by market cap gives 3.5, so supply not yet circulating carries real weight. And CoinGlass's open interest of $161.40M equals 47.2% of market cap. Why does that matter? Futures bets that large can force more liquidations.
Support sits 3.6% below price, and the first resistance zone sits 26.1% above. A buyer risking $0.044 targets $0.316, a 7.2 to 1 setup.
Actually, that ratio flatters, since the 24h low of $1.12 already dipped under $1.166.
For the Official Trump Price Prediction, the probe headline pushed the price down, and shorts took most of the latest liquidations. But supply stays concentrated, so rallies need fresh buyers. A daily candle trading above $1.526 would change that view.
TRUMP Technical Analysis: 50-Day EMA and RSI Chart Analysis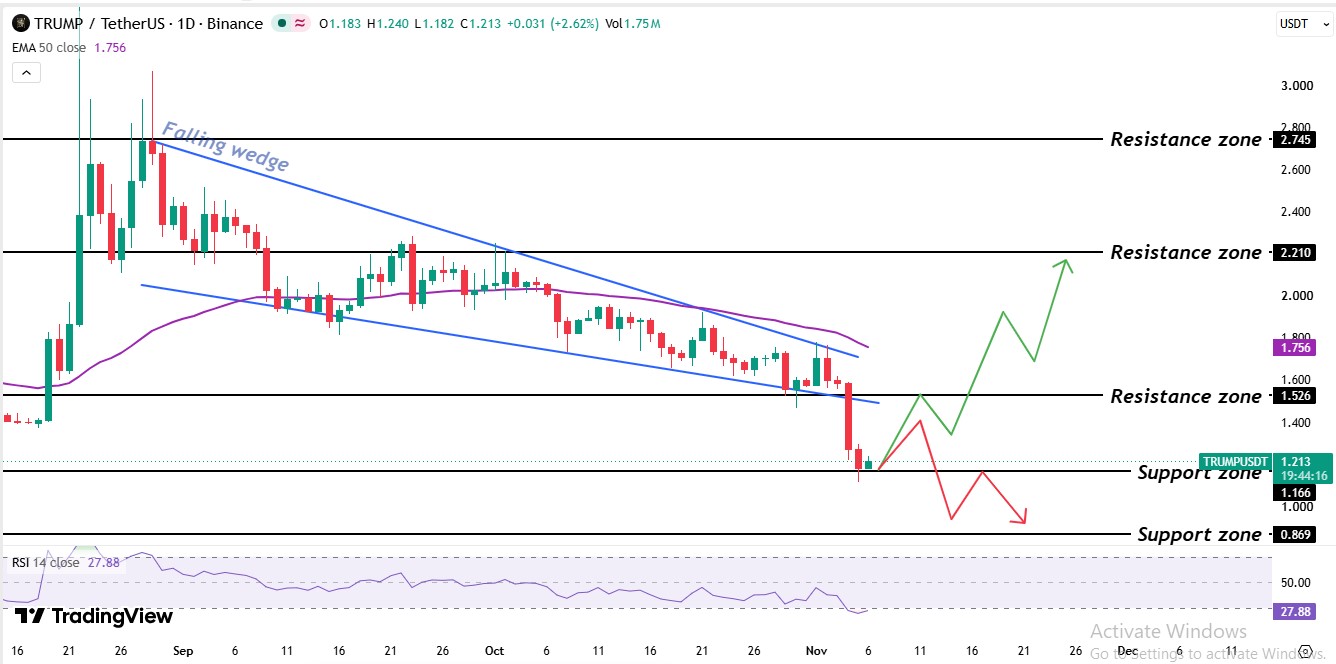
Source: TradingView, TRUMP/USDT, Nov 6, 2026, 04:30 UTC
The 1-day chart for TRUMP/USDT on TradingView frames this Official Trump price prediction. A sharp August rally spiked above the $3.00 level before sellers took control.
Price then slid inside a falling wedge, two falling trendlines that narrow price action. The market tried many times to break the upper trendline of the wedge, but sellers defended it, and the earlier Official Trump forecast covers the prior setup.
Then the lower wedge support gave way near the $1.526 zone. Price dropped to the $1.166 support zone, where buyers have stepped in.
Right now, the price trades 3.6% above the $1.166 support zone. It also sits under the broken wedge support and the $1.756 50-day EMA.
The TRUMP 50-day EMA sits at $1.756, and TRUMP's $1.21 price trades 31.1% below it. The latest daily candle trades below the EMA too, and the wedge resistance sits just under it, so a real recovery needs both level.
The TRUMP RSI reads 27.88 on the 14-day setting. Under 50 means sellers hold the momentum edge. A reading under 30 means selling has gone too far and a bounce is possible.
TRUMP Support Levels and Resistance Levels
Level | Price |
Resistance | $2.745 |
Resistance | $2.210 |
50-day EMA | $1.756 |
Resistance | $1.526 |
Support | $1.166 |
Support | $0.869 |
TRUMP Bull, Base, and Bear Scenarios for November
Scenario | Trigger | Target | Invalidation |
Bull | Trades above $1.526 | $1.756, then $2.210 | Falls below $1.166 |
Base | Holds above $1.166 and below $1.526 levels | Range | Leaves the range |
Bear | Trades below $1.166 | $0.869 | Trades above $1.526 |
A probe escalation can swing the price in hours, and a failed bounce at $1.526 would keep sellers in control.
Official Trump Price Prediction: Expert Outlook
As per CoinGabbar analysis, the stance is range-bound with a bearish tilt. One wallet holds 71.81% of the supply, and shorts took $3.62M of the 12-hour liquidations, so neither side is safe. The Official Trump Price Prediction stays capped below $1.526.
Watch for a daily candle trading under $1.166 while open interest rises above $161.40M. That pairing would show fresh shorts pressing and would open the path to $0.869.
YMYL Disclaimer: This article is for educational and informational purposes only. It does not offer financial advice, price guarantees, or return promises. Crypto assets are volatile