PAX Gold Pattern Repeats? Key Entry Levels for Long-Term Holding


PAX Gold is trading at $4,310.93, up 0.87% on the day.
PAX Gold's chart is showing the same setup twice. Back in early August, $PAXG broke out of a tight range and jumped over 12% in a single move.
Gold Price today ($PAXG) have since rallied, rolled over, and slipped into a fresh descending channel, one that looks a lot like the range that preceded that first breakout.
This PAX Gold price prediction walks through that pattern and what a repeat breakout could mean for $PAXG's next move.
PAXG Technical Analysis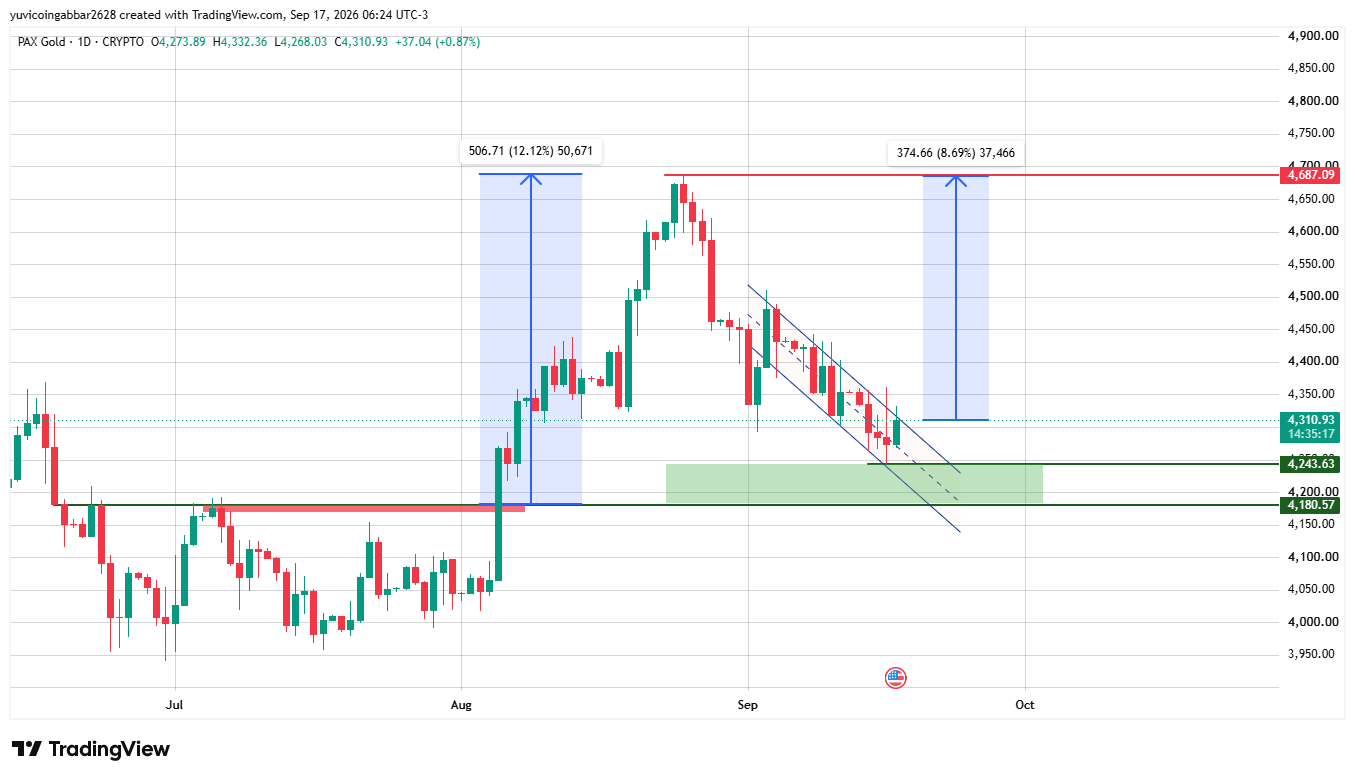
Back in late July, PAX Gold kept trading below $4,180.57, treating it as resistance. Once the price broke above it in early August, PAXG jumped over 12% in one sharp move, part of a rally that carried the price up to $4,687.09 by early September.
From that high, $PAXG rolled over into a descending channel, the same lower-highs, lower-lows pattern seen before the earlier breakout, just forming after the rally this time instead of before it.
Price is now at $4,310.93, sitting just above support at $4,180.57 and $4,243.63, the same zone that once acted as resistance.
Since the channel looks similar to the earlier one, the chart projects a repeat move: a close above the channel's upper trendline could bring a similar-sized move, around 8.69%, back toward $4,687.09.
This is a pattern repeating, not a guarantee. PAX Gold needs to actually close above the trendline, not just touch it, for that projection to matter.
Right now the price is closer to support than resistance, so the breakout isn't confirmed yet. If the channel holds instead, it could keep drifting toward $4,180.57 to $4,243.63.
Gold Price Prediction Levels: PAX Gold Forecast
| Level Type | Price |
| Resistance (major high) | $4,687.09 |
| Immediate Price Reference | $4,310.93 |
| Support / Resistance Flip Level | $4,243.63 |
| Deeper Support | $4,180.57 |
PAXG Price Prediction: Triggers & Invalidation
| Scenario | Trigger | Likely Outcome | Invalidation Point |
| Channel breakout | Closes above the channel's upper trendline | Push toward $4,687.09 | Fails to close above the trendline |
| Support hold | Holds between $4,243.63 and $4,310.93 | Range-bound before next attempt | Break below $4,243.63 |
| Channel breakdown | Loses $4,180.57 | Deeper pullback | Support zone lost |
PAX Gold Price Prediction: Can $PAXG Reach $4,687.09?
$4,687.09 is the same high PAXG already tested once in early September, and it's the level the current channel breakout would target if the pattern repeats.
Reaching it again would need PAXG to close above the channel's upper trendline first, since price hasn't shown that kind of strength since rolling over from that high.
PAX Gold Price Prediction 2026: Expert View
According to CoinGabbar analysts , PAXG has already shown a pattern the current channel is worth watching closely.
But the setup isn't confirmed until the price actually closes above the trendline until then, PAXG is just as likely to keep sliding toward the $4,180.57 support zone as it is to break out again.
Disclaimer
This piece is for informational purposes only and isn't financial advice. The levels and scenarios above are based on technical chart analysis and publicly available data at the time of writing, and crypto markets can move sharply within hours, so past patterns don't guarantee future outcomes. It's worth doing independent research and considering your own risk tolerance before acting on any of the levels discussed here.


















