PEPE Price Prediction: Will Whales Back the Trendline Breakout?


Is the Pepe coin rally real, or just a squeeze with good timing?
As of October 21, 2026, 05:30 UTC, PEPE trades at $0.000004505, up 7.38% in 24 hours.
That move broke a downtrend first flagged in the falling channel analysis. Every PEPE price prediction now hinges on one level.
$PEPE Market Snapshot
Metric | Value |
Price | $0.000004505 |
24h change | +7.38% |
Market cap | $1.86B (+7.39%) |
Fully diluted valuation | $1.86B |
Circulating supply | 413.77T PEPE |
Max supply | 413.77T PEPE |
Holders | 621.43K |
Source: data taken from CoinMarketCap data
Pepe Open Interest Data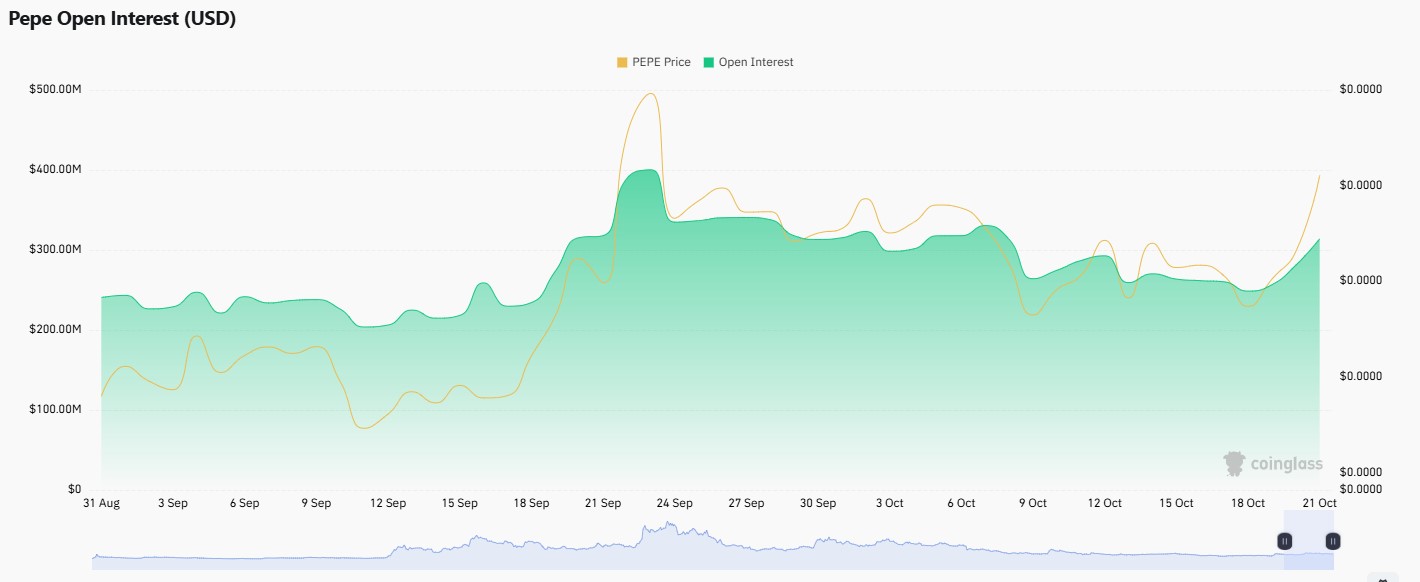
That jump matters because the price rose right along with it. When both climb together, it usually means fresh money is entering the market, not just old traders cashing out.
But more open positions also mean bigger swings in both directions, so the market is now more sensitive to any sudden move. There’s still a hurdle ahead too, since the late-September peak near $400M sits overhead. This rally has room to run, but it also has a clear level to prove itself against.
Pepe Liquidation Data
Source: Data taken from CoinGlass
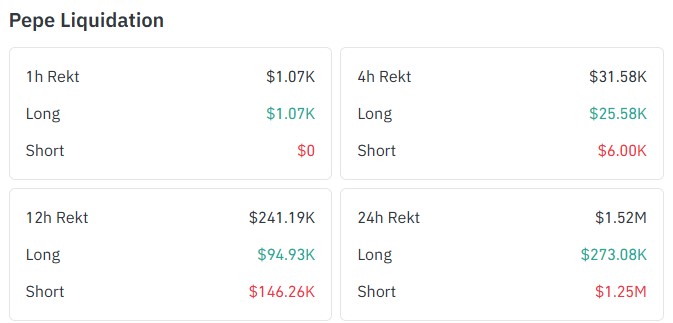
Shorts took the hit over the last 24 hours. Total liquidations reached $1.52M, with $1.25M coming from shorts and only $273.08K from longs. A liquidation is a forced exit when a trader’s margin runs out.
The 12-hour total dropped to $241.19K, with shorts still ahead at $146.26K. The last 4 hours saw just $31.58K, and the last hour only $1.07K, all from longs and $0 from shorts. With the short pressure mostly cleared, fresh spot buyers must now step in to keep the rally going.
Pepe Futures Trading Volume by Exchange
Source: Data taken from CoinGlass
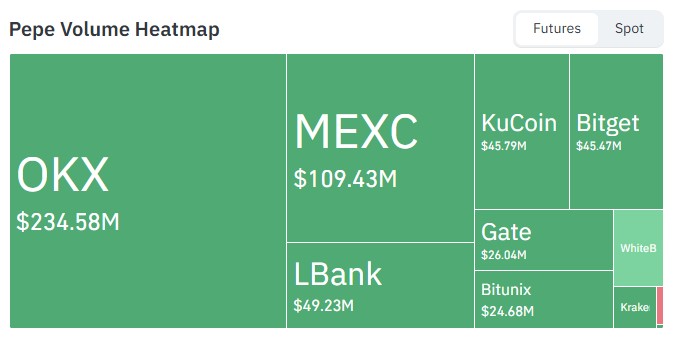
Exchange volume shows where the trading actually happens. On the Coinglass futures heatmap, OKX leads with $234.58M, and MEXC trails at $109.43M.
That puts OKX at more than double MEXC and nearly five times LBank's $49.23M. KuCoin follows at $45.79M, and Bitget sits right behind at $45.47M.
Busy venues matter because they set the price that others follow. And the 4-hour chart in this article comes from OKX, the busiest one.
Pepe Whale Concentration Data:
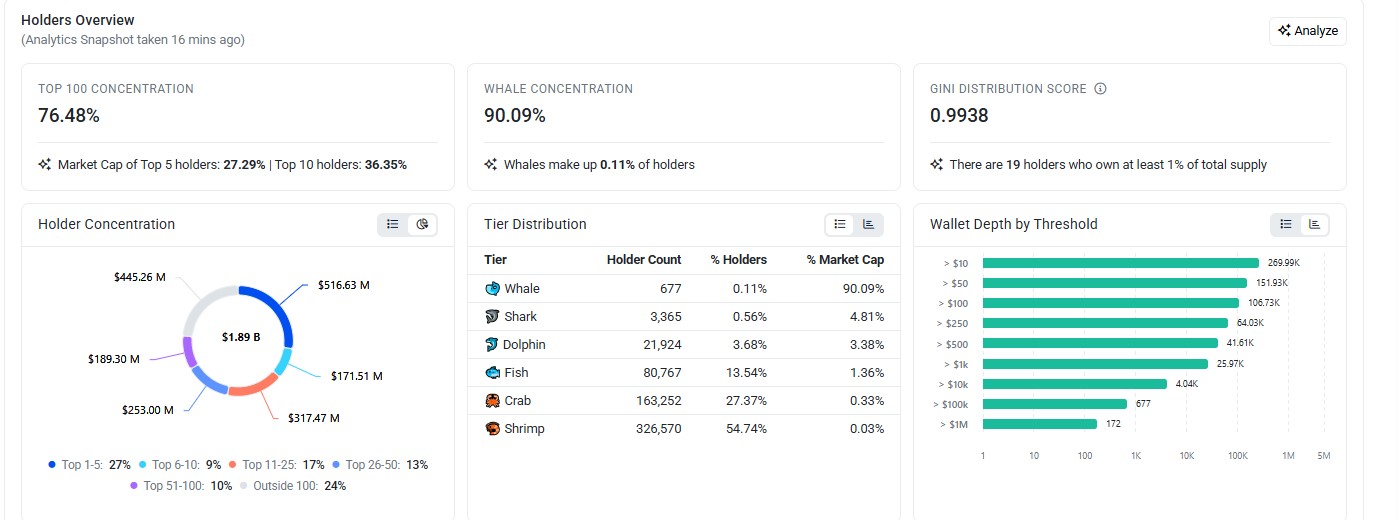
Etherscan holder data shows the top 100 wallets hold 76.48% of supply.
Just 677 whale wallets, 0.11% of holders, control 90.09% of market cap. The Gini score, a 0-to-1 inequality measure, sits at 0.9938. That's near maximum.
Nineteen wallets own at least 1% each, while 326,570 shrimp wallets hold 0.03% combined. Concentration like this can speed up rallies when big wallets buy.
Is PEPE Outperforming SHIB and DOGE Right Now?
As of October 21, 2026, the Pepe coin leads this trio. $PEPE rose 7.38%, against 2.7% for DOGE and 2.06% for SHIB.
Turnover tells a sharper story. PEPE's volume equals 26.19% of market cap, versus 3.91% for DOGE and 1.6% for SHIB. Smaller caps swing harder and that's the risk.
For contrast, this Dogecoin channel support breakdown shows DOGE testing a floor.
Metric | PEPE | SHIB | DOGE |
Price | $0.000004498 | $0.000005105 | $0.08151 |
24h change | +7.38% | +2.06% | +2.7% |
Market cap | $1.86B | $3B | $14.03B |
Volume change | +119.5% | +17.88% | +31.03% |
Pepe Price Prediction: 4-Hour Chart Technical Analysis
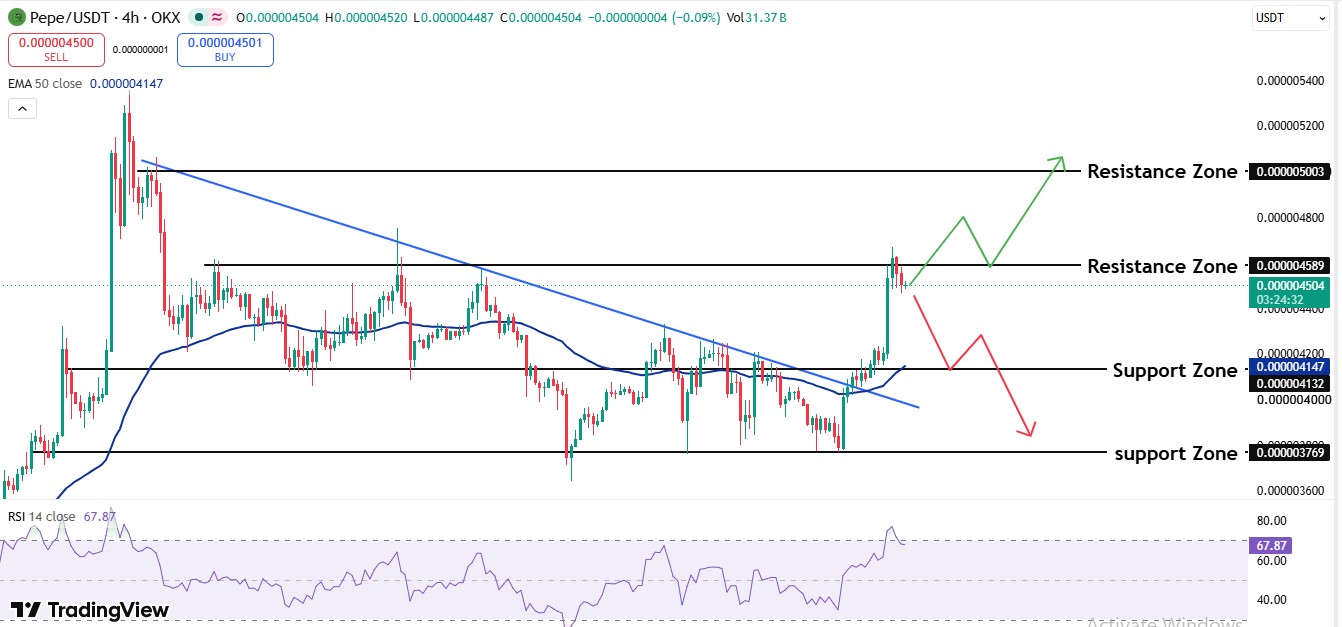
On the 4-hour chart, $PEPE trades inside a range after breaking a descending trendline. A trendline is a sloping line connecting lower highs, and the price pushed through it on October 19.
The line rejected the price about six times. A rejection means the price touched the line and sellers pushed it back down, so each failure strengthened the ceiling. The range has a floor at $0.000003769 and a ceiling at $0.000004589.
An EMA, or exponential moving average, tracks average trading prices while weighting recent action more. The 50 EMA sits at $0.000004147, and the price trades above it.
RSI, a momentum gauge from 0 to 100, reads 67.87, so buyers lead the price, but overbought territory near 70 sits one push away. But a pullback toward $0.000004147 wouldn't break the pattern, and the $PEPE chart leaves room for one.
Buyers hold the pen above $0.000004147. Below it, sellers take over.
$PEPE Support and Resistance Levels
Levels | Price |
Resistance 2 | $0.000005003 |
Resistance 1 | $0.000004589 |
Support 1 | $0.000004132 |
Support 2 | $0.000003769 |
Pepe Price Prediction: Bull, Base, Bearish Scenario
Bull Scenario
A trade above $0.000004589 and a holding retest, where the price revisits the broken level, opens at $0.000005003.
Base Scenario
Holding between $0.000004147 and $0.000004589 keeps PEPE in a range. Sideways trading lets RSI cool.
Bearish Scenario
Losing $0.000004147 makes the breakout a fake-out, a rally that fails fast. Then $0.000003769 becomes the target.
Sentiment flips fast, and the memecoin news feed tracks those swings.
Case | Target | Invalidation |
Bull | $0.000005003 | Trades below $0.000004147 |
Base | Range | Breaks either level |
Bear | $0.000003769 | Reclaims $0.000004147 |
PEPE Price Forecast: Expert Outlok
As per Coingabbar analysis, the $PEPE price forecast rests on two levels: $0.000004147 and $0.000004589.
Trading above $0.000004589 targets $0.000005003. A slip below $0.000004147 targets $0.000003769.
The Pepe coin outlook stays constructive, though whale concentration and rising open interest keep risk high.
That keeps the PEPE price prediction tilted bullish while buyers defend $0.000004147.
Disclaimer: This article is for informational purposes only and isn't financial advice. Cryptocurrency, especially memecoins, is highly volatile and can lose value quickly. Readers should do their own research before making any trading decision.