Pieverse Price Prediction: Can New Listings Push Past $3.14?


Even after the exchange listing news, PIEVERSE still trades below $3.138.
This Pieverse price prediction begins with PIEVERSE cooling after a sharp rally and squeezing into a tight band. Price now sits between two such levels. A previous Pieverse analysis covers the earlier setup, and this update adds the new listings and the 4H chart.
Where Does PIEVERSE Stand After a 4.48% Daily Gain?
CoinMarketCap data shows PIEVERSE at $3.04 after a 4.48% gain over 24h. It ranks 56th by market cap.
Market cap stands at $913.39M, while FDV, or fully diluted valuation (the market cap if every token circulated), sits at $3.04B. Circulating supply is 300.35M of 1B tokens.
Did two new listings lift trading? Volume fell 40.08% to $99.99M over 24h, a window that includes both listings. It seemed thin at first. at about 11% of market cap. But falling volume leaves fewer buy orders to absorb a sudden sell.
HTX and Poloniex Exchange Listings News
A spot listing opens a token for direct trading. Per the official Poloniex post, deposits opened at 11:00 UTC, and full trading started at 12:00 UTC.
The official HTX post says deposits are open and trading starts soon.
Source: Poloniex and HTX official X post, captured Nov 21, 2026, 08:20 UTC
Both posts are under a day old, so this Pieverse news is still fresh. Price is up 4.48% over 24 hours, a window that includes both listings.
If volume builds on these venues, buyers could test $3.138. Wider exchange headlines sit on the latest crypto news page.
What Could Holder Concentration Change for PIEVERSE Support Levels?
BscScan holder data shows the top 100 wallets holding 98.59% of the tracked supply.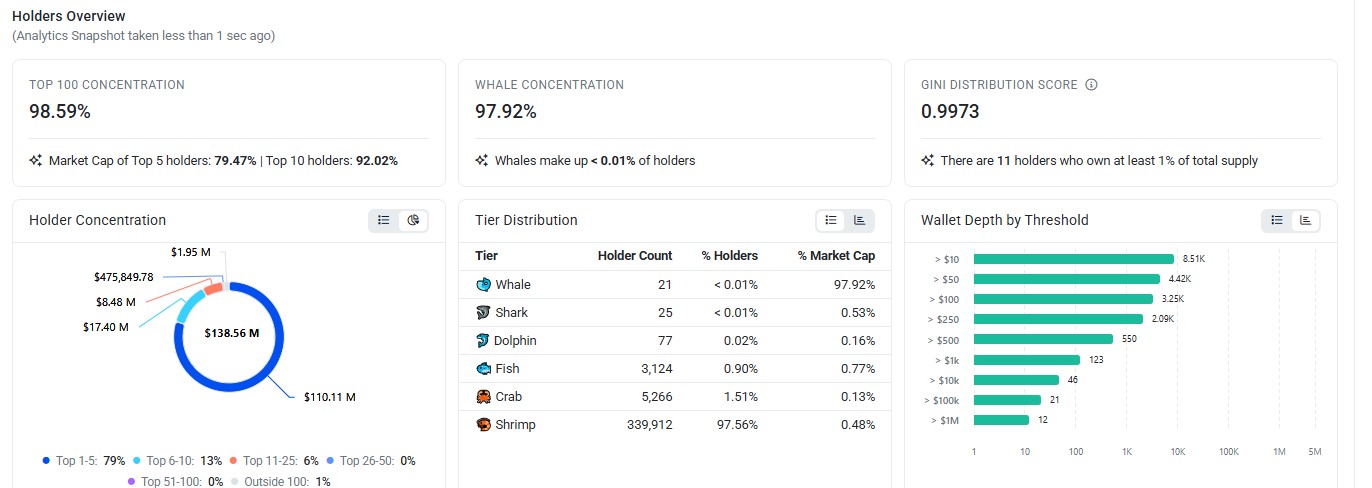
Source: BscScan, Pieverse (PIEVERSE) token holders overview, captured Nov 21, 2026, 08:20 UTC
Five wallets hold 79.47% and ten hold 92.02%. Whales, meaning very large wallets, number 21 and hold 97.92%.
And a handful of large wallets could add sell pressure if transfers reach exchanges, which would test the $2.799 support level first.
Pieverse Price Forecast: Triangle Pattern
The TradingView 4H chart frames this Pieverse price prediction. Buyers drove a sharp rally from near $1.80 into the $3.63 resistance level before sellers pushed back.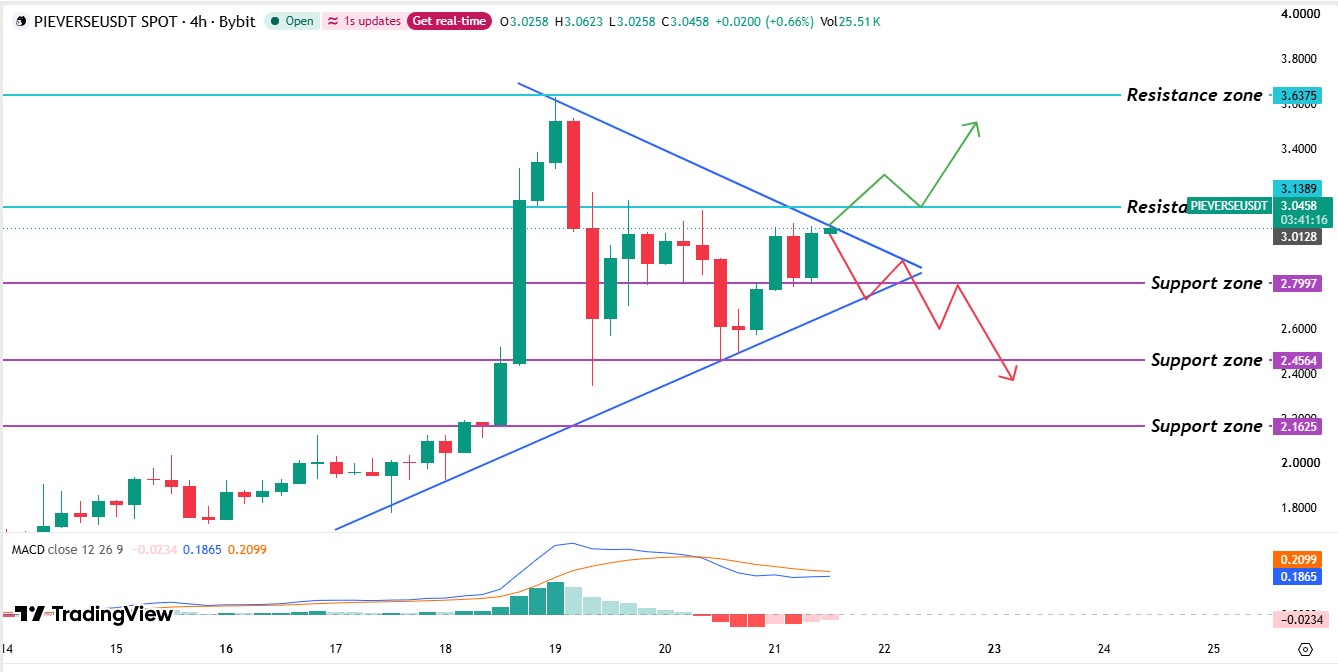
Source: TradingView, PIEVERSEUSDT 4H chart on Bybit with MACD (12, 26, 9) shown, captured Nov 21, 2026, 08:20 UTC
Sellers then pushed the price lower, and a long wick dipped below the $2.456 support level. But buyers recovered quickly.
From there, PIEVERSE traded in a range, a band held between a support level at $2.799 and a resistance level at $3.138. Buyers tried several times to reclaim $3.138 and failed. The $3.138 level was passed on the way up and lost on the way down, so it now acts as a resistance level.
Recent green candles lifted the price back above the $2.799 support level. The latest candle sits at the upper edge of a symmetrical triangle, a pattern where highs fall and lows rise. A break above the upper edge points to $3.138 and then $3.637. Under the lower edge, the next stops are $2.799 and $2.456.
These levels can be compared with the earlier Pieverse targets for context. Right now, PIEVERSE trades above the $2.799 support level and below the $3.138 resistance level.
The MACD line reads 0.1865, and the signal line reads 0.2099. Both sit above zero, which favors buyers. The histogram, the gap between the two lines, reads -0.0234, so upside momentum is cooling.
Support and Resistance Levels
Level | Type |
$3.637 | Resistance level |
$3.138 | Resistance level |
$2.799 | Support level |
$2.456 | Support level |
$2.16 | Support level |
Pieverse Price Forecast: Bull, Base, and Bear Scenarios
Bull: A daily candle trading above $3.138 targets $3.637, with rising volume needed to confirm. A daily candle back below $3.138 cancels it.
Base: Price stays between $2.799 and $3.138 and trades sideways while volume stays soft. A daily candle breaking either level ends it.
Bear: A daily candle trading below $2.799 targets $2.456, with thin liquidity on the slide. A daily candle back above $2.799 cancels it.
Expert Outlook: Pieverse Price Prediction
According to CoinGabbar analysis, this Pieverse price prediction leans toward sideways trade. Volume is down 40.08% over 24h, and the MACD line trades under its signal line.
Buyers recovered from a dip below $2.456. The $3.138 resistance level is only 3.3% away. The $3.138 level is the one to monitor, because a daily candle trading above it would show buyers regaining control.
Disclaimer: This article is for information only and isn't financial advice. Traders should do their own research and risk only what they can afford to lose.