Bedrock Price Projection: Why Is BR Suddenly Talk of Crypto Twitter?

A quiet DeFi token just forced its way back onto every trader's watchlist, and nobody saw the wallet numbers behind it coming. That is the story we are about to unpack before a single price target gets mentioned.
When a Small BTC Restaking Token Suddenly Refuses to Stay Quiet
Something shifted for Bedrock this week, and it is not the kind of move that fades in a day. The Bedrock price projection conversation is loud again, and the loudness has receipts behind it.
Traders on Binance, Bybit, and MEXC watched BR rip through a level it had been stuck under for weeks. But volume told a different story than price alone.
Here's the thing: big moves without wallet context usually fade fast. This one has holder data, tokenomics, and a liquidation trail attached.
So where does BR go from here, and who is really driving this rally?
Bedrock Price Projection: Why Is BR Suddenly Talk of Crypto Twitter
Key Takeaways
-
BR trades near $0.2380, up more than 20% in 24 hours, with a $71.81M market cap.
-
The Bedrock price projection leans bullish in the near term while trading holds above the $0.1805 to $0.1985 support band.
-
Whale wallets control over 98% of BR supply, a concentration risk any Bedrock crypto price prediction must weigh.
-
Resistance sits near $0.2757, then $0.3643, based on Fibonacci mapping.
-
Short sellers took the brunt of recent liquidations, a sign this move caught bears off guard.
Bedrock Price Projection: Where BR Stands Right Now
As of August 19, 2026, near 09:15 UTC, BR trades around $0.2380, up 20.91% across 24 hours, per CoinMarketCap market data.
Market cap sits at $71.81M. Fully diluted valuation runs far higher, near $238.04M, since only 301.66M of the 1B max supply circulates.
24-hour trading volume hit $3.3M, a volume-to-market-cap ratio of 4.51%. Liquidity against market cap reads just 1.75%, thin enough that large trades still move price fast.
The token touched an all-time high of $0.2733 five days ago. It also carries an all-time low of $0.03902 from April 2025, over 475% below where BR trades now.
Why Is Bedrock (BR) Price Moving Today
Turns out, the catalyst is not a random social post. BscScan on-chain data shows over 229 million transfers and 81,785 holders engaging with the BR contract.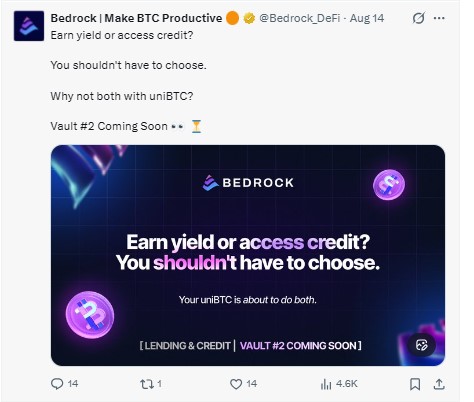
Bedrock's team flagged a new product angle recently. On X, the Bedrock DeFi vault teaser pitched uniBTC as a way to earn yield and access credit without choosing one over the other.
That kind of utility narrative pulls fresh capital into a restaking token. Combine it with a broader BTCfi rotation, plus renewed attention on upcoming coin events and unlocks, and BR had the ingredients for a squeeze.
We pulled up the derivatives data next, and short sellers were clearly caught leaning the wrong way.
Bedrock Daily Chart Analysis: Support, Resistance Technical Structure
The daily BRUSDT chart on MEXC shows BR breaking out of a descending channel it had traded inside for months. That structure alone matters more than any single candle.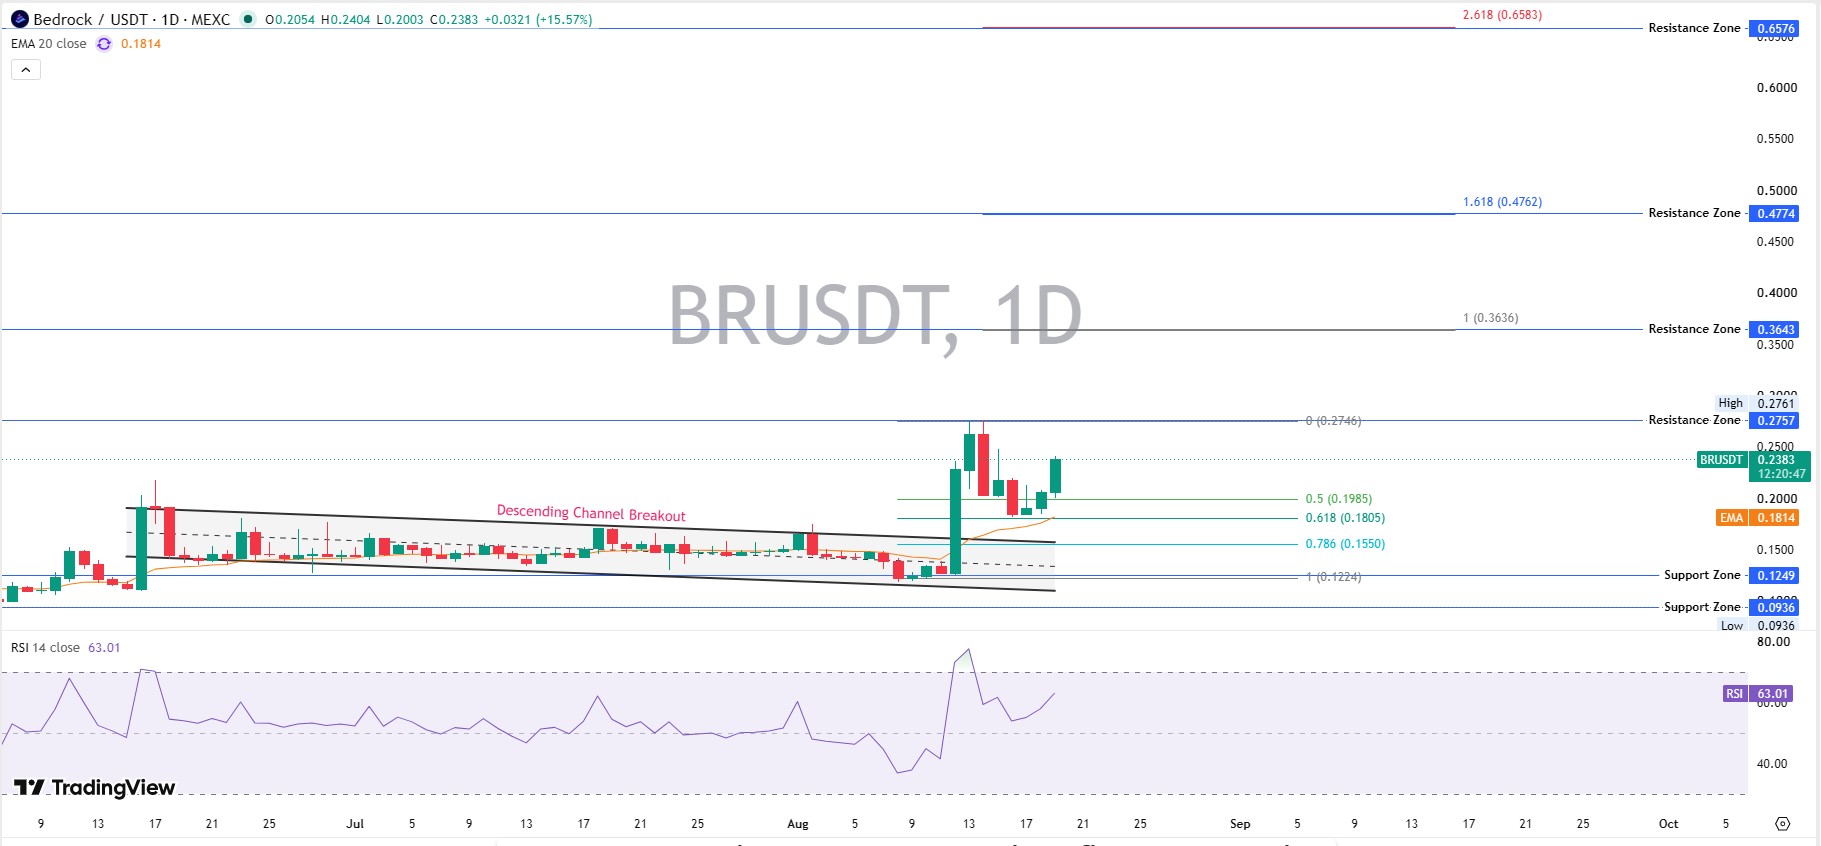
Price trades well above its 20-day EMA of $0.1814, confirming bullish momentum on the daily timeframe. RSI sits at 63.01, firm but not yet overbought.
Fibonacci retracement from the recent swing puts key support at $0.1985 (0.5 level) and $0.1805 (0.618 level). Below that, $0.1550 marks a deeper floor.
On the upside, resistance stacks at $0.2757, then $0.3643, then a stretch target near $0.4774. Holding above $0.2757 opens the next leg toward $0.36.
But a rejection at resistance with fading volume would flip this structure back into a range. That is the level to watch.
BR Tokenomics and Vesting Schedule Explained
Total supply caps at 1,000,000,000 BR, with an initial circulating supply of just 210,000,000 tokens, or 21% of max, per Bedrock's tokenomics documentation.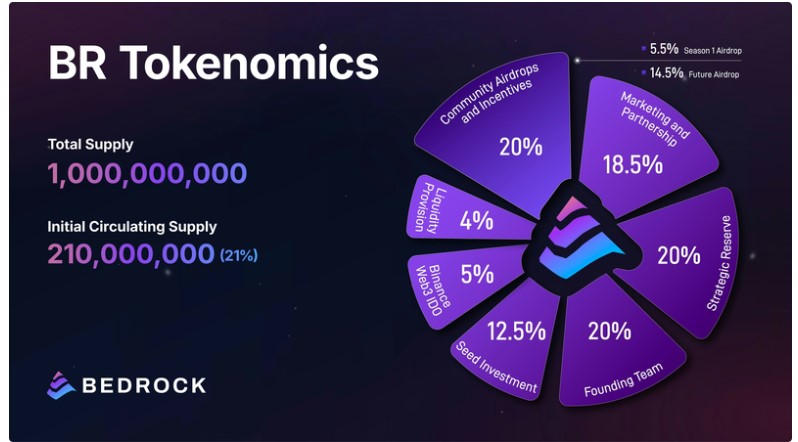
Community airdrops take 20% of the supply, vesting linearly over five years. Marketing and partnerships get 18.5%, stretched across eight years.
Seed investors hold 12.5%, locked one year before monthly vesting begins. The founding team holds 20%, under a two-year lockup followed by bimonthly releases.
Strategic reserve makes up another 20%, capped at 5% usable per year. Community holders following ongoing crypto airdrop activity should note none of this unlocks overnight, which matters for any long-term Bedrock price projection.
Whale Concentration and Holder Distribution: Risk Behind the Rally
Here's the number that should give every trader pause. Onchain analytics from BscScan's holder dashboard show the top 100 wallets hold 99.59% of circulating BR.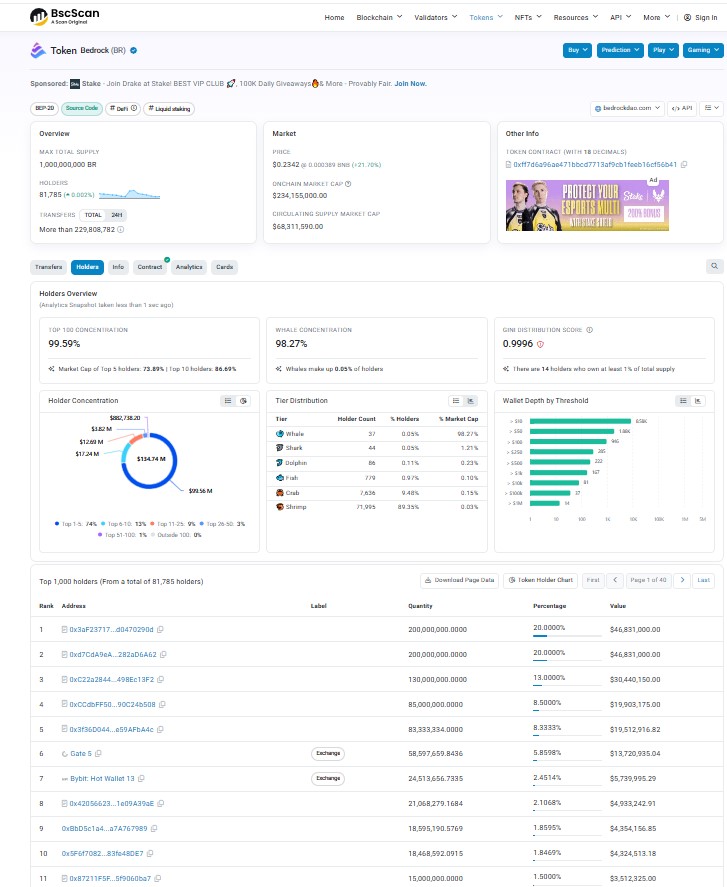
Whale wallets make up just 0.05% of total holders yet control 98.27% of supply. The Gini score reads 0.9996, above most benchmarks for concentrated ownership.
Fourteen wallets alone own at least 1% of the total supply each. Two addresses hold 20% each, worth roughly $46.8M apiece at current pricing.
That is not automatically bearish. Exchange wallets like Gate and Bybit sit among the top ten, a detail worth reading alongside the latest crypto news today, since it suggests some concentration is custodial, not personal accumulation.
Still, any Bedrock token price prediction needs to flag this. A coordinated exit from three or four large wallets could hit price hard.
Bedrock Liquidations and Trading Volume Across Exchanges
Breaking: Short sellers got squeezed hard over the past day. Coinglass data shows $65.05K in total liquidations over 24 hours, and $62.28K of that came from short positions.
Longs barely got touched, losing just $2.77K. The one-hour window alone wiped out $15.83K in shorts with zero long liquidations.
That lopsided pattern usually means bears were positioned against the breakout and paid for it. Binance alone processed $11.87M in BR trading over 24 hours, a scale that stands out even against macro-driven moves tied to Fed policy news, with BingX, LBank and Bybit adding several million more.
Is Bedrock an Altcoin Worth Watching in 2026
BR is not a memecoin chasing hype. It is a BTC restaking altcoin built around letting Bitcoin holders earn yield without giving up custody entirely.
That use case separates it from purely speculative tokens. Altcoin cycles reward projects with real deposits and integrations, not just social volume.
Bedrock's CertiK rating of 4.2 stars adds audited credibility many smaller altcoins lack, fitting the BTCfi narrative gaining traction across the wider crypto market this year.
Bedrock Price Prediction: Bear, Base, and Bull Scenarios
| Timeframe | Bear Case | Base Case | Bull Case | Probability | Invalidation |
| 7 Days | $0.19 | $0.24 – $0.27 | $0.30 | Bear 25% / Base 50% / Bull 25% | Trading below $0.1805 |
| 30 Days | $0.15 | $0.28 | $0.36 | Bear 30% / Base 45% / Bull 25% | Trading below $0.1550 |
| Early 2027 | $0.10 | $0.35 | $0.48 – $0.66 | Bear 35% / Base 40% / Bull 25% | Trading below $0.0936 |
These targets come from Fibonacci extension mapping, current EMA structure, and BR's historical volatility since its April 2025 low. None of this is a guarantee, and every scenario depends on trading volume holding up.
Risks That Could Break the Bedrock Price Projection
Whale concentration remains the biggest single risk. With 98.27% of supply in so few wallets, one large transfer can move price far more than fundamentals justify.
Vesting unlocks and adds pressure too. Seed and team allocations begin releasing on schedule, and a fresh supply hitting the market can cap rallies even in a positive tape.
Liquidity against market cap sits at just 1.75%, meaning slippage risk stays real for anyone trading size. Regulatory shifts remain a background risk as well, worth tracking through broader crypto regulation coverage.
Conclusion
The Bedrock price projection into early 2027 leans cautiously bullish, built on a genuine chart breakout, a real BTC restaking use case, and short sellers who bet wrong this week. Fine.
But the whale concentration story is not going away, and it deserves as much attention as any price target. The Selini vault fill forecast adds useful context here.
New exchange listings tend to shift this kind of setup quickly too, something the crypto exchange listing tracker stays on top of.
Disclaimer
This article is for informational purposes only and does not constitute financial, investment, or trading advice. Cryptocurrency markets, including Bedrock (BR), are highly volatile, and all price scenarios discussed are probability-based estimates, not guarantees. Always do your own research and consult a licensed financial advisor before making investment decisions.
Also read:







.webp)








