Decentraland Price Prediction August 2026: $MANA Wedge Breakout?


A token that spent most of this cycle grinding lower just went quiet in a way that traders notice. No fireworks, no big liquidation spike, just a slow tightening of the range. That kind of calm before a move is exactly when a real Decentraland price prediction matters most. So what happens when this coil finally lets go?
Decentraland Price Prediction: Why MANA Is Back On Traders' Radar
This Decentraland price prediction matters right now because MANA has stopped trending and started coiling. It's been doing this for months, and that's rarely a permanent state.
Here's the thing: quiet charts don't stay quiet.
There's a wider gaming and metaverse narrative sitting in the background, and it tends to resurface whenever risk appetite ticks up across the sector. Traders watching the crypto news today coverage have flagged MANA as one of the names sitting closest to a structural decision point.
But narrative alone doesn't move price. The chart has to confirm it first.
Is MANA finally ready to break its multi-year slide, or is this just another pause before the next leg down?
Key Takeaways
MANA trades near $0.06739, up about 1.83% in the past 24 hours per CoinMarketCap, though the same TradingView candle shows a smaller 0.75% daily gain, a timing gap worth noting.
Daily RSI sits at 46.35, neutral. Weekly RSI reads 34.22, leaning weak, and that gap is the real story behind this Decentraland price prediction.
The weekly chart is still inside a falling wedge that's been building since 2023, with an earlier failed breakout already on record.
On-chain holder data shows just 0.05% of wallets (134 addresses) controlling 84.79% of market cap, with a Gini score of 0.9916.
24-hour liquidations total only $5.73K, mostly shorts, a sign of thin positioning rather than aggressive momentum.
Table of Contents
Why Decentraland Is Moving This Week
Decentraland Technical Analysis: Daily Chart
Decentraland Technical Analysis: Weekly Chart
Decentraland Support and Resistance Levels
MANA Tokenomics and Whale Concentration
Decentraland Price Prediction: Scenarios By Timeframe
Can MANA Reach $1?
Risks To Watch
Why Decentraland Is Moving This Week
Price sits near $0.0674, with a 24-hour trading volume around $10.94M against a market cap of $133.83M, per CoinMarketCap. That's a volume-to-cap ratio near 8.12%, moderate and not explosive.
Liquidity is thin. CoinMarketCap's own liquidity-to-cap reading sits at just 0.09%, and that thinness is part of why MANA can swing hard on relatively small volume. Readers tracking new venue listings can check the exchange listing tracker for where fresh liquidity tends to land first.
Derivative activity stayed calm. Total liquidations over 24 hours came in near $5.73K, split between $1.90K in longs and $3.82K in shorts, per Coinglass. Binance carries the largest share of futures volume, followed by LBank and BingX.
Decentraland Technical Analysis: Daily Chart
MANA/USDT daily, Binance via TradingView, captured July 31, 2026, 06:00 UTC.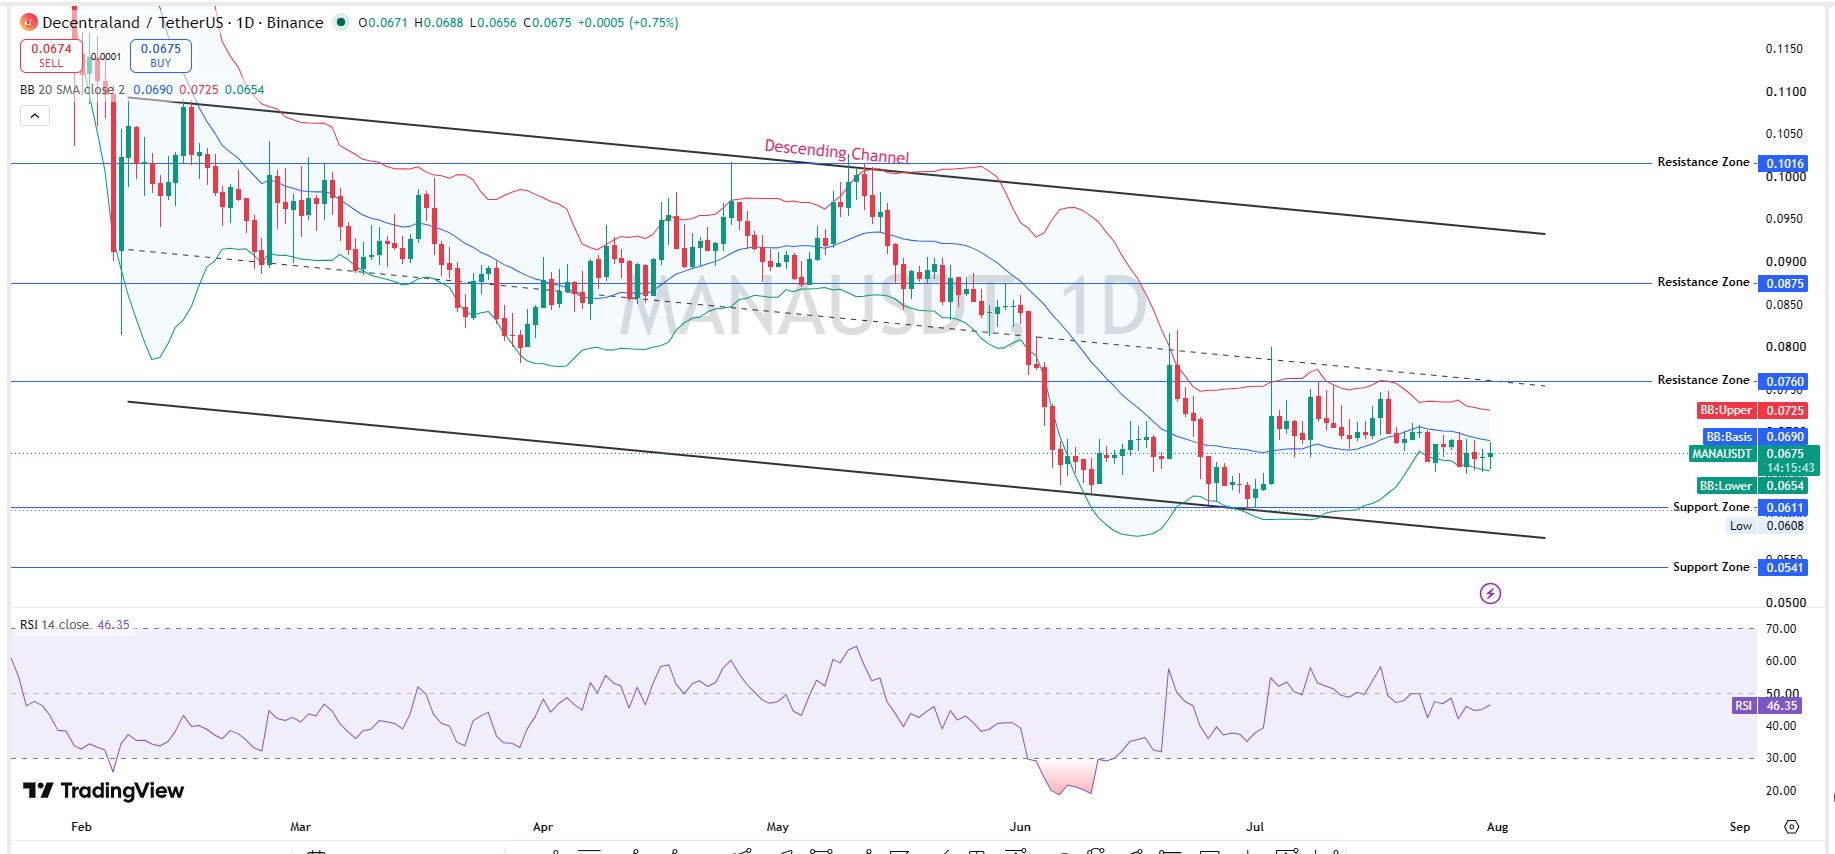
On the daily timeframe, MANA opened at $0.0671, ran to a high of $0.0688, and closed near $0.0675, up 0.75% on the session. Daily Bollinger Bands (20 SMA, close, 2) show the basis at $0.0690, the upper band at $0.0725, and the lower band at $0.0654. Price sits inside the bands, not stretched either way. Daily RSI-14 reads 46.35, dead center, no clear momentum edge.
Resistance zones stack at $0.0760, $0.0875, and $0.1016. Support zones sit at $0.0611 and $0.0541, with the session low at $0.0608.
Decentraland Technical Analysis: Weekly Chart
MANA/USDT weekly, Binance via TradingView, captured July 31, 2026, 06:00 UTC.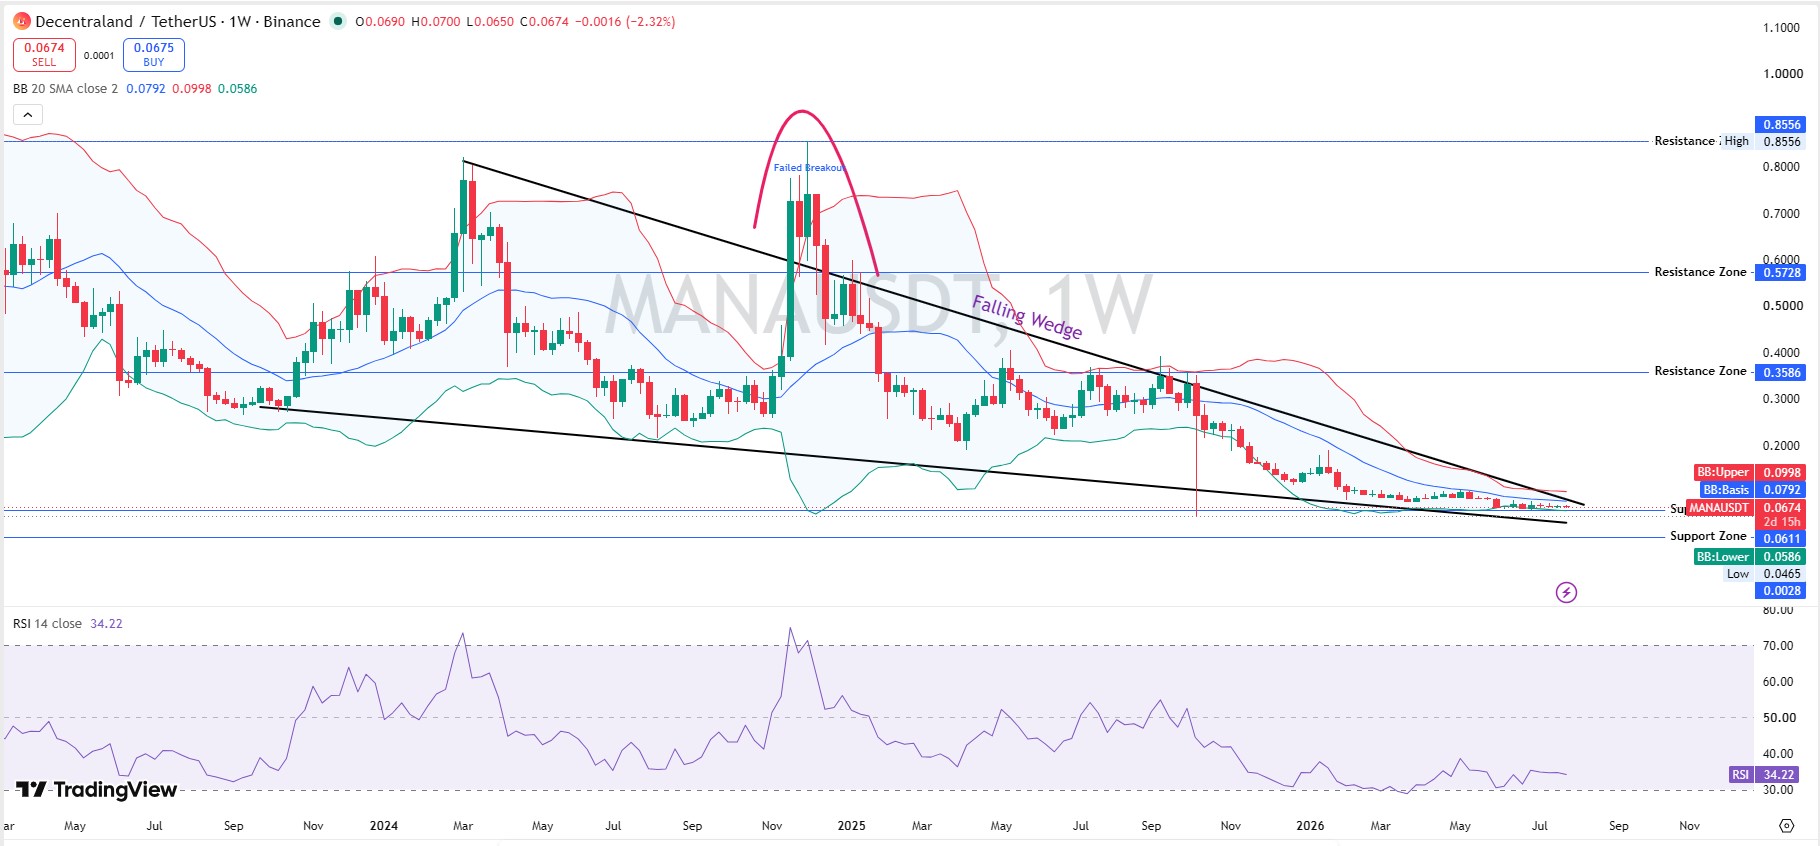
The weekly chart tells the deeper story behind this Decentraland forecast. MANA opened at $0.0690, hit $0.0700, and closed near $0.0674, down 2.32% on the week. It's still inside a falling wedge that traces back to 2023, with a documented failed breakout already visible on the chart from late 2024.
Weekly Bollinger Bands show a basis of $0.0792, an upper band of $0.0998, and a lower band of $0.0586. Price trades below the basis, a soft structure. Weekly RSI sits at 34.22, closer to oversold than overbought, which lines up with a token that's been fading for years rather than spiking.
Decentraland Support and Resistance Levels
Immediate resistance is on a daily basis at $0.0690, then $0.0725, $0.0760, and $0.0875. A weekly close above $0.0792 would be the first real sign this Decentraland price target conversation can shift higher.
Support starts at $0.0654, then $0.0611, then the weekly Bollinger lower band at $0.0586. Below that, $0.0541 and $0.0465 are the levels that would confirm the wedge has failed again.
MANA Tokenomics and Whale Concentration
Circulating supply sits near 1.98B MANA against a total supply of 2.19B, per CoinMarketCap. Holder count is 283,960, broadly flat over 24 hours.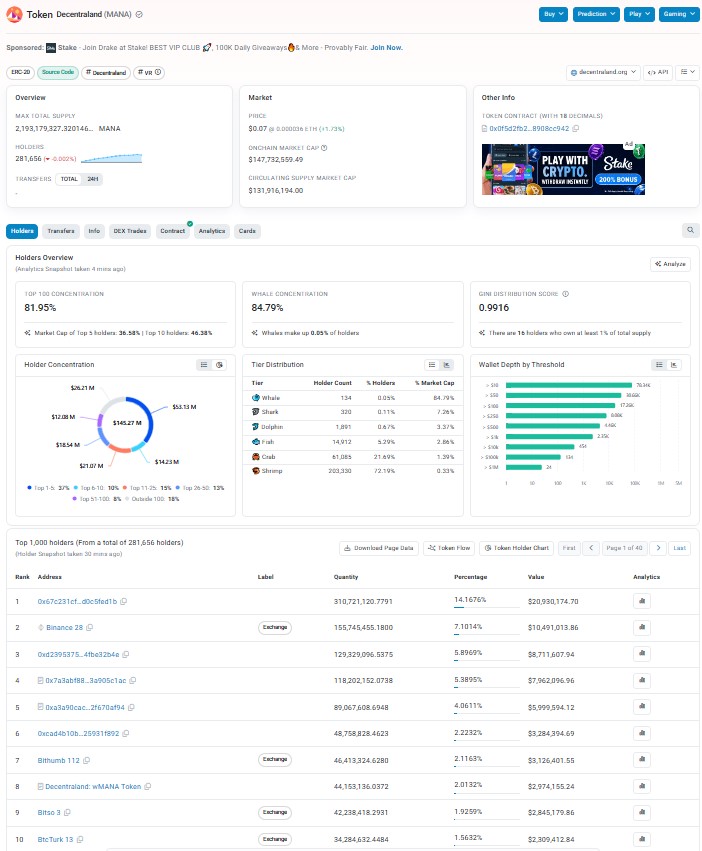
Onchain data from Etherscan tells a sharper story. Top 100 wallets hold 81.95% of supply. Whale-tier wallets, just 134 addresses, or 0.05% of holders, control 84.79% of market cap. The Gini score is 0.9916, with 16 wallets each holding at least 1% of the supply.
The single largest wallet holds 14.17% ($20.93M), unlabeled. Binance's hot wallet ranks second at 7.10%. Combined, the top 10 hold 46.38% of the supply, which is a real concentration risk for anyone reading a long-range Decentraland forecast.
Decentraland Price Prediction: Scenarios By Timeframe
Timeframe | Bull Case | Base Case | Bear Case |
24H | Reclaims $0.0690, tests $0.0725 (probability: moderate) | Holds $0.0654-$0.0690 range (probability: high) | Slips under $0.0654 toward $0.0611 (probability: low) |
7D | A weekly close above $0.0792 shifts structure (probability: low-moderate) | Range-bound $0.0611-$0.0725 (probability: high) | Wedge fails, drops toward $0.0586 (probability: moderate) |
August 2026 | Sector rotation lifts MANA toward $0.0875-$0.1016 (probability: low) | Chops between $0.055-$0.075 through the month (probability: moderate) | Concentration-driven selling drags price to $0.0465-$0.0541 (probability: low-moderate) |
Invalidation for the bullish case is a daily close under $0.0611. These are directional reads tied to the current setup, not guarantees, and every MANA price prediction here carries the same caveat: thin liquidity can push levels faster than the table suggests.
Can MANA Reach $1?
Not from here. Going from $0.0674 to $1 needs close to a 15x move, and MANA's all-time high was $5.90 back on November 25, 2021, now down 98.86% from that peak. A more realistic Decentraland price target for this stretch sits closer to the $0.10 zone, the upper resistance band flagged above, not a dollar.
Risks To Watch
Whale concentration tops the list. A Gini score of 0.9916 means very few wallets can move this market on their own.
Liquidity is thin relative to market cap, so moves in either direction can overshoot quickly. And the wedge has already failed once before, so a second breakdown wouldn't be unusual. For sector-wide context, see the Bitcoin price prediction 2026 and Ethereum price prediction 2026 coverage.
Whether Decentraland is a good investment right now depends on risk tolerance, since this setup mixes a coiling chart with heavy whale control. Readers can also track related project updates through the Decentraland news coverage and browse the wider price prediction hub for other tokens.
Methodology: Chart levels from MANA/USDT daily and weekly charts on Binance via TradingView, RSI-14, and 20-period Bollinger Bands, captured on July 31, 2026, at 06:00 UTC. Supply and market data from CoinMarketCap. Holder concentration and Gini score from Etherscan. Liquidation and futures volume from Coinglass. This is speculative market commentary, not financial advice.
Disclaimer: This is speculative market commentary, not financial advice. Crypto assets are volatile. Data is current as of July 31, 2026, 06:00 UTC; verify live figures before trading.











.jpg)






