DeepSnitch AI Price Prediction: $0.001 Floor or Break, DSNT Spike Next


By Crypto Markets Analyst. Reviewed by the Crypto Markets Editor. Data captured from a live DEX price tracker, July 30, 2026.
Is DSNT's current price a floor that's about to hold, or just the last stop before a token with almost no DSNT daily volume finds a new low?
That is the real question behind this DeepSnitch AI price prediction. DSNT dropped sharply on a single candle in the past 24 hours and has spent the hours since grinding sideways just above $0.00104.
The kind of pattern that could be stabilization or could simply be a market too thin to move further in either direction yet.
Table of Contents
-
Key Takeaways
-
DSNT Price Snapshot: Verified Tracker Data
-
Chart Analysis: What the Sharp Drop and Flat Recovery Actually Show
-
DeepSnitch AI Price Prediction: Floor Holds vs. Breakdown
-
Why DSNT's Thin Volume Limits Confidence in Any Single Signal
-
Expert View: What Would Actually Confirm a Spike
-
Glossary
-
Disclaimer
-
FAQs
Key Takeaways
DSNT trades at $0.00104, down 3.31% over 24 hours, after a sharp single-candle drop early in the trading window shown on the chart.
TVL sits at $18.5K, slightly lower than levels seen in recent prior updates, worth watching as a usage signal independent of price.
24-hour volume is $161.88, thin enough that even modest buying or selling can move price disproportionately.
DSNT trades at roughly 4.3% of its 52-week high of $0.0242 and more than three times above its 52-week low of $0.000330.
DSNT Price Snapshot: Verified Tracker Data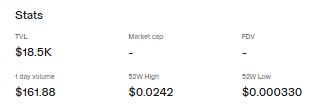
Source: DSNT Stats by Uniswap, captured July 30, 2026
| Metric | Value |
|---|---|
| Current Price | $0.00104 |
| 24-Hour Change | -3.31% |
| TVL | $18.5K |
| 24H Volume | $161.88 |
| 52-Week High | $0.0242 |
| 52-Week Low | $0.000330 |
Chart Analysis: What the Sharp Drop and Flat Recovery Actually Show
The 24-hour chart shows a distinct pattern: $DSNT held a relatively stable range through the morning, then dropped sharply in a single move during the afternoon window, before spending the remaining hours consolidating in a tight band just above $0.00104.
That shape matters for this DeepSnitch AI price prediction because it distinguishes two different explanations for the current price.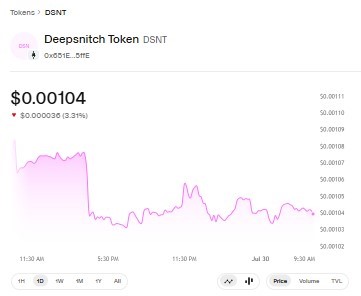
Source: DeepSnitch AI Trading Chart by Uniswap
A gradual decline across many small candles would suggest broad, sustained selling pressure.
A single sharp drop followed by flat consolidation, which is what this chart actually shows, more often indicates one or two larger sell orders hitting thin liquidity at once, followed by the market settling because there simply is not enough volume left to move it further in either direction.
Neither reading confirms where DSNT goes next, but the second pattern is generally a lower-conviction signal than sustained selling would be.
DeepSnitch AI Price Prediction: Floor Holds vs. Breakdown
Direct answer: with $DSNT trading in a tight band just above $0.00104 and volume this thin, the most likely near-term paths are a continued sideways grind or a modest test of levels slightly below current price, rather than a dramatic move in either direction absent a specific catalyst.
A floor-holds scenario has $DSNT continuing to trade in its current $0.00100 to $0.00110 band, with the sharp drop treated as an isolated event rather than the start of a trend.
A breakdown scenario has DSNT slipping below $0.00100 on continued thin volume, opening a path toward retesting levels closer to its $0.000330 low if selling pressure persists.
A spike scenario requires a specific, verifiable catalyst, a listing announcement, a partnership confirmation, or a sudden surge in platform usage reflected in TVL, since thin-volume tokens like $DSNT do not typically spike on sentiment alone.
Invalidation triggers: the floor-holds scenario is undermined by a sustained close below $0.00100 across multiple consecutive readings.
The breakdown scenario is undermined by TVL growing alongside price stabilization, which would suggest renewed platform usage rather than just a quiet market.
Why DSNT's Thin Volume Limits Confidence in Any Single Signal
At $161.88 in 24-hour volume, DSNT sits in a range where a single moderately sized trade can represent a meaningful share of total daily activity.
That has a direct consequence for this DSNT price prediction: both the floor-hold and breakdown scenarios above should be read as provisional rather than confirmed, since a market this thin can shift from one pattern to the other on very little actual buying or selling.
The more reliable signal to track is not the next single-day price move; it's whether volume and TVL both trend upward together over several consecutive days, which would indicate real participation returning rather than a temporary lull.
Expert View: What Would Actually Confirm a Spike?
CoinGabbar analysts note that DSNT's chart pattern today, a sharp single-candle drop followed by flat consolidation, is meaningfully different from the kind of gradual, multi-day decline that typically signals sustained selling conviction, and treating the two as equivalent would overstate the bearish case.
That said, low conviction selling does not automatically imply a bullish reversal either; it simply means the current price reflects a thin, quiet market rather than strong directional demand in either direction.
Analysts recommend watching TVL specifically over the coming days as the more informative signal, since TVL growing independent of price would suggest genuine platform usage returning, a stronger precondition for any real DSNT spike than a single green candle on low volume would be.
Glossary
-
TVL (Total Value Locked): The dollar value of assets held in a project's liquidity pool or platform.
-
Consolidation: A period where price trades within a narrow range after a larger move, often reflecting reduced trading conviction.
-
Price Discovery: The process by which a market determines an asset's price through trading activity; thin volume can distort this process.
-
Support Level: A price zone where historical buying activity has previously slowed or reversed a decline.
Disclaimer
Informational purposes only, not financial advice. All price scenarios are analyst estimates, not guarantees. DSNT trades with extremely low liquidity, increasing volatility and slippage risk. No DSNT listing has been confirmed. Cryptocurrency carries a significant risk of loss. Verify data through official channels before deciding.









.jpg)








