Ether.fi Price Prediction: $ETHFI Buys Back Rally, $2 Next?


ETHFI is waking up and traders can't stop talking about it. Arthur Hayes just bought back into $ETHFI after selling it at a loss months ago, and now he's calling $2 "just maths."
That kind of reversal from a name like Hayes has crypto Twitter buzzing. This Ether.fi Price Prediction checks if the hype matches the chart.
Market data was checked on August 24, 2026, at 1:03 IST.
Ether.fi Price Prediction Today: Market Overview
| Metric | Value |
| Price | $0.6331 |
| 24h Change | +6% |
| Market Cap | $650.26M (+11.81%) |
| Unlocked Mkt Cap | $619.5M |
| FDV | $638.56M |
| 24h Volume | $118.3M (+83.14%) |
| Vol/Mkt Cap (24h) | 18.1% |
| Liquidity/Mkt Cap | 0.37% |
| Total Supply | 1B ETHFI |
| Max Supply | 1B ETHFI |
| Circulating Supply | 1.01B ETHFI |
| Holders | 150.84K |
Source: Data from CoinMarketCap as of August 24, 2026, at 1:03 IST. Figures may vary slightly across other tracking websites.
Arthur Hayes Buys Back $1.17M of $ETHFI
Arthur Hayes bought back $1.17 million worth of $ETHFI at around $0.62, months after selling a large position at a loss.
He's now accumulating again at a lower price.
Hayes: "$2 Is Just Maths" for ETHFI
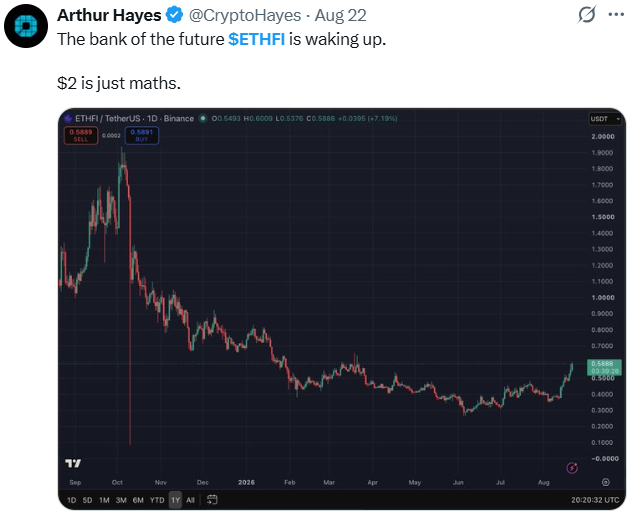
Source: Data From X
Hayes said, "The bank of the future $ETHFI is waking up," adding that $2 is "just maths."
Note: This is Hayes' own opinion and price target, not a confirmed forecast or guaranteed outcome, and CoinGabbar could not independently verify the reasoning behind the $2 figure.
Ether.fi Price Prediction Chart: Technical Analysis
Pair: ETHFI/USDT · Market: Spot (Crypto) · Exchange: KuCoin · Timeframe: 1D · Source: TradingView · Timestamp: August 24, 2026, 12:03 UTC+5:30
ETHFI broke above a long descending trendline that had capped the price since December.
The key is for the price to hold above the current support level, which could help sustain momentum and support further upside.
Both EMAs sit below the current price, with EMA 20 at $0.5026 and EMA 50 at $0.4489, confirming the breakout is running above its recent average.
RSI is reading 77.51, in overbought territory, a level that often precedes a pause even inside a genuine trend shift.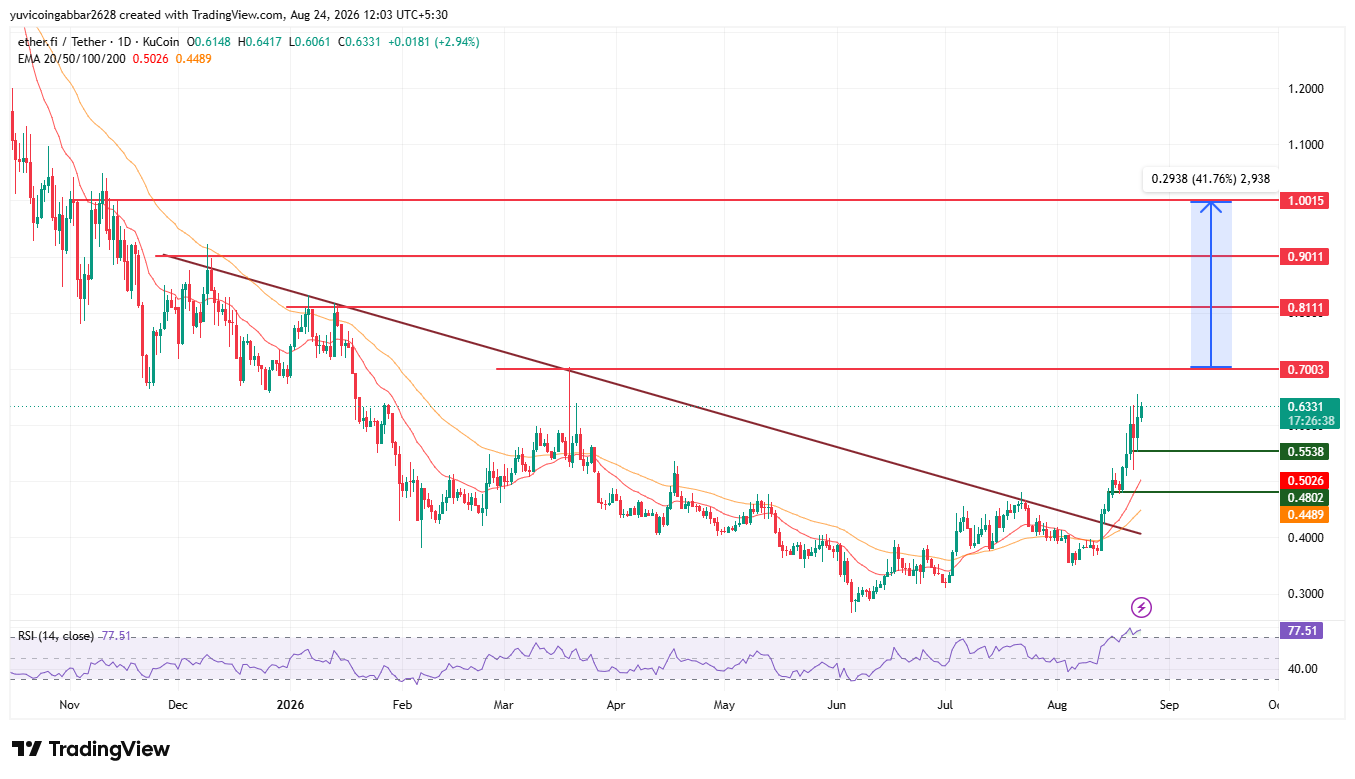
Ether.fi Price Prediction: Support and Resistance Levels
| Level Type | Price |
| Resistance 4 | $1.0015 |
| Resistance 3 | $0.9011 |
| Resistance 2 | $0.8111 |
| Resistance 1 (nearest) | $0.7003 |
| Immediate Price Reference | $0.6331 |
| First Confirmed Support | $0.5538 |
| Deeper Support | $0.4802 |
Ether.fi Forecast: Bull Case vs. Bear Case
Bull case: Holding above $0.5538 keeps the trendline breakout intact. A confirmed close above $0.7003 would open the path toward $0.8111 and eventually $0.9011.
Bear case: An RSI above 77 leaves $ETHFI exposed to a pullback. Losing $0.5538 would put the breakout in doubt, with $0.4802 as the next support to watch.
Can $ETHFI Reach $1.0015?
$1.0015 is the highest resistance level marked on the chart.
Getting there would require $ETHFI to clear $0.7003, then $0.8111, then $0.9011 in sequence, a multi-stage move rather than a single leg, and one that would likely need continued momentum from the buyback and accumulation narrative around it.
Ether.fi Price Prediction: Expert View
According to CoinGabbar analysts , $ETHFI's breakout lines up with a real catalyst rather than pure hype: a known trader publicly rebuilding a position he'd previously exited at a loss.
That said, an RSI above 77 means the move is already stretched, so some cooldown toward $0.5538 wouldn't be surprising even in a genuine trend reversal.
The $0.5538 to $0.7003 range is the zone to watch: holding it keeps the breakout thesis alive, while a clean break above $0.7003 opens real room toward $0.8111 and beyond.
Disclaimer: This piece is for informational purposes only and isn't financial advice. The levels and scenarios above are based on technical chart analysis and publicly available data at the time of writing, and crypto markets can move sharply within hours, so past patterns don't guarantee future outcomes. It's worth doing independent research and considering your own risk tolerance before acting on any of the levels discussed here.
Also read:












.webp)




