Ethereum Price Slides After Warsh's Jackson Hole Speech: What’s Next?


Ethereum Slips to $2,435 After Fed Chair Warsh's Jackson Hole Speech
Ethereum price fell to $2,435 on Saturday, down 2.50% over the past day. The drop followed comments from Fed Chair Kevin Warsh at the 2026 Jackson Hole Symposium. Traders did not like what they heard.
ETH had been sitting near its highs before the speech. Now it is testing a level that traders say actually matters.
Why Did the Price Drop Today?
The token's sell-off traces back to Jackson Hole, Wyoming. According to CNBC, Warsh said recent PCE and CPI inflation readings came in better than expected. But he stopped short of saying the underlying inflation trend had meaningfully improved.
He also did not lay out a clear rate path. Instead, Warsh called for a "quieter Fed." That means a central bank that leans less on forward guidance and gives markets fewer hints to trade around.
This is a shift from how former Chair Jerome Powell ran things. Powell often used rate cut signals to calm Wall Street down. Warsh seems to be doing the opposite on purpose.
Markets reacted fast. Traders had priced in a pause for the September meeting. Any sign that easy money is not a sure thing tends to hit risk assets like crypto first, and Ethereum felt it right away.
ETH Price Today: Key Numbers
Metric | Value |
ETH Price | $2,433.77 |
24h Change | -2.54% |
Futures Volume | ~$42.72B |
Open Interest | ~$32.28B |
Options Volume | +7.94% |
Options Open Interest | +2.78% |
Long/Short Ratio | 0.9693 |
Total Liquidations (24h) | $94.36M |
Long Liquidations | $73.67M |
Short Liquidations | $20.70M |
The long/short ratio sits just under 1, which points to a fairly balanced market with a small lean toward shorts. Some major exchanges still show more long positions than short ones, so the picture is not one-sided.
Liquidations tell a clearer story. Long traders took the bigger hit, losing $73.67 million compared to $20.70 million on the short side. That lines up with a price drop catching leveraged buyers off guard.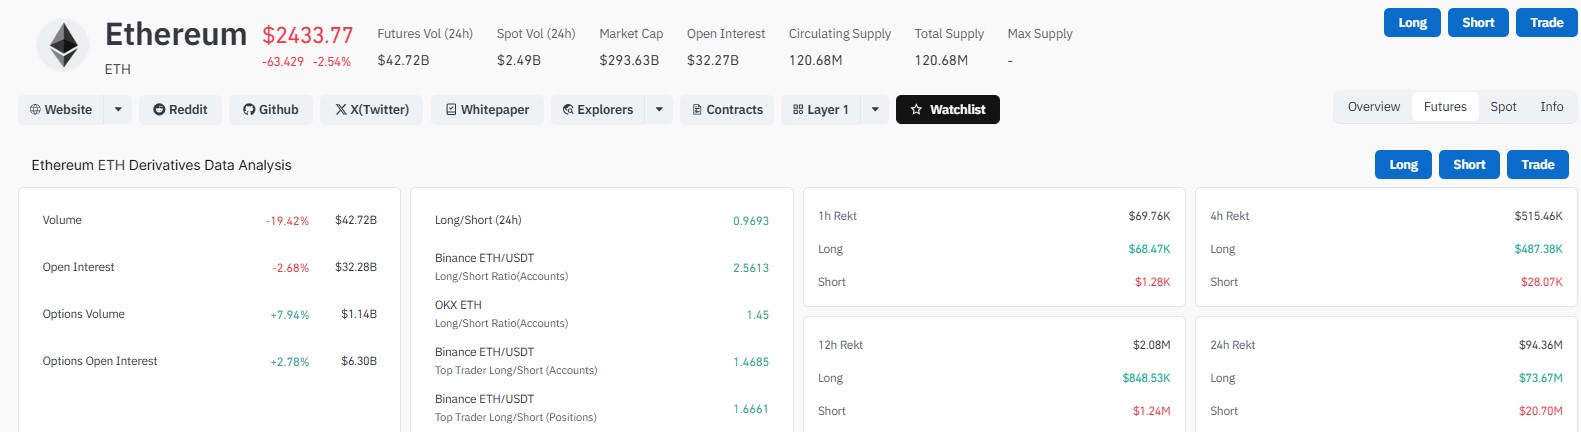
Are ETH ETFs Still Seeing Inflows?
Yes, and this is the part that stands out. Spot Ethereum ETFs pulled in $102 million in net inflows on the day, according to SoSoValue data. That extends the inflow streak to 10 straight trading days.
From August 17 to August 27, Ethereum ETFs took in $1.42 billion total. BlackRock's ETHA fund did most of the heavy lifting, accounting for 72% of that inflow.
Bitcoin funds told a different story. A nine-day Bitcoin ETF inflow streak snapped on August 28 with a $202 million outflow. So while Bitcoin funds saw money leave, Ethereum funds kept pulling money in.
Cumulative ETF inflows for the token have now crossed $12 billion since the funds launched in July 2024. Bitcoin ETFs still lead by a wide margin, holding over $54 billion cumulatively, but the recent trend shows investor momentum shifting toward ETH for now.
Lower Treasury yields and a generally favorable macro setup helped support ETH's risk appetite during this stretch, even with the Fed uncertainty hanging over the market.
Ethereum Price Prediction: What Levels Matter Now
ETH has reached a point where the next move actually means something.
Price ran from around $1,900 up to the $2,550 area earlier this year. It then spent several days moving sideways near those highs. Now it sits back around $2,400.
As long as the $2,400 to $2,420 zone holds, the first target on a bounce is a move back through $2,480 to $2,500. Above that, the real test becomes the $2,535 to $2,555 local high.
A clean break and hold above that zone would open the door to $2,600 to $2,650, followed by $2,750. If momentum keeps building from there, $3,000 becomes the main upside target on the chart.
Losing $2,400 changes the picture. In that case, $2,350 becomes the next level worth watching.
The path forward looks like this:
Hold $2,400
Reclaim $2,500
Break the local highs near $2,555
Then look higher from there
A pullback by itself is not a red flag yet. The structure only starts to look weak if buyers fail to defend the same zone that supported the last leg higher.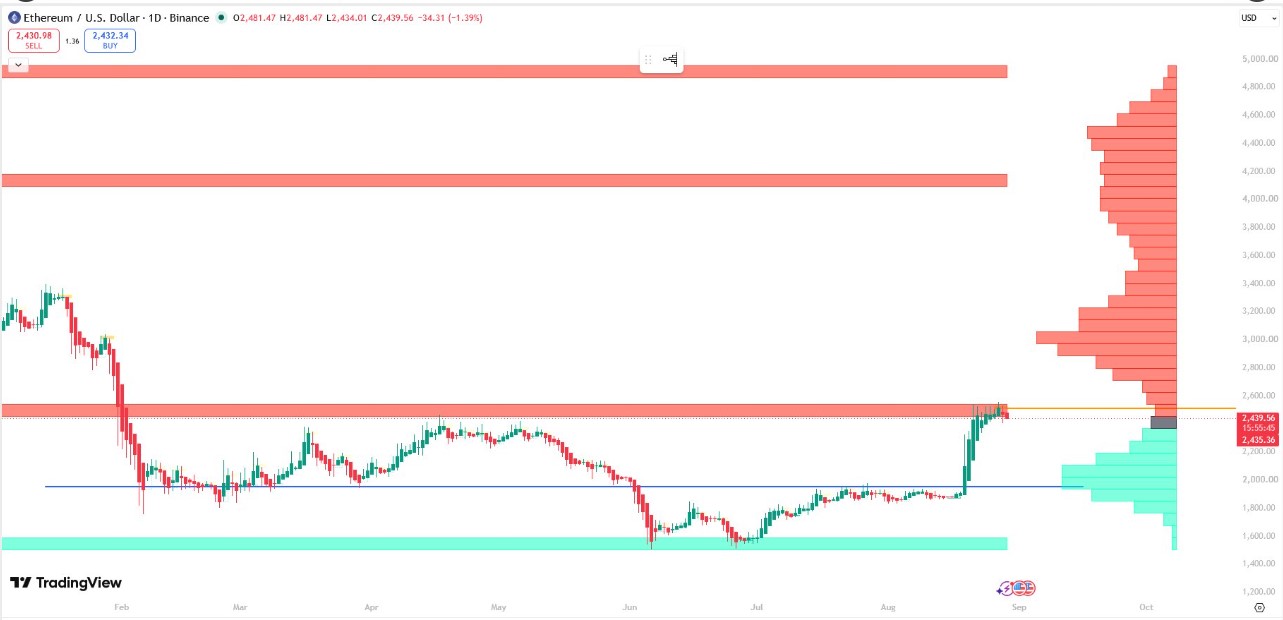
The Bigger Chart: A Full Price Round Trip
Zooming out, ETH has basically round-tripped an entire year in eight months. Price went from $2,650 down to $1,500, and now back up to resistance near $2,440.
Looking at the volume profile, almost nothing has traded above $2,600. That means there is very little historical trading activity, or "air," sitting above the current price.
If ETH breaks that shelf, there is not much standing between here and $3,000 or higher. But a rejection at this level sends price straight back into the $1,600 to $2,200 zone, where the bulk of past volume actually sits.
That is the setup right now. A coiled spring, with the next move likely to be a big one either way.
Disclaimer
This article is for informational purposes only and should not be treated as financial or investment advice. Cryptocurrency markets are highly volatile, and prices can move sharply in either direction. Always do your own research and consult a licensed financial advisor before making investment decisions.
Also read:

















