Flare Price Prediction: $FLR Volume Explodes 545%, Is $0.01 Next?


$FLR ripped higher over the past day and is now taking a breather right under a big resistance wall.
This Flare price prediction comes as traders watch closely to see if buyers step back in.
Volume has spiked hard, and social media is already talking about a "full-scale rise" if this level breaks.
Did you miss the move, or is there still time to catch the next leg up?
Market data was checked on September 1, 2026, at 12:46 IST.
Flare Price Prediction Today: Market Overview
| Metric | Value |
| Price | $0.0069667 |
| 24h Change | +10% |
| Market Cap | $609.77M |
| FDV | $744.85M |
| 24h Volume | $20.6M+ |
| Vol/Mkt Cap (24h) | 3.39% |
| Total Supply | 106.46B FLR |
| Max Supply | -- |
| Circulating Supply | 87.15B FLR |
Source: Data from CoinMarketCap as of September 1, 2026, at 12:46 IST. Figures may vary slightly across other tracking websites.
Why Is the FLR Price Up Today?
FLR's big move happened over the last day or so, not in the latest daily candle, which is actually red.
The tracker's 24h window still holds most of that earlier rally, and volume up over 547% points to heavy participation during the move.
No specific confirmed catalyst has been identified at the time of writing.
$FLR Crypto News Today: $FLR Community Buzz 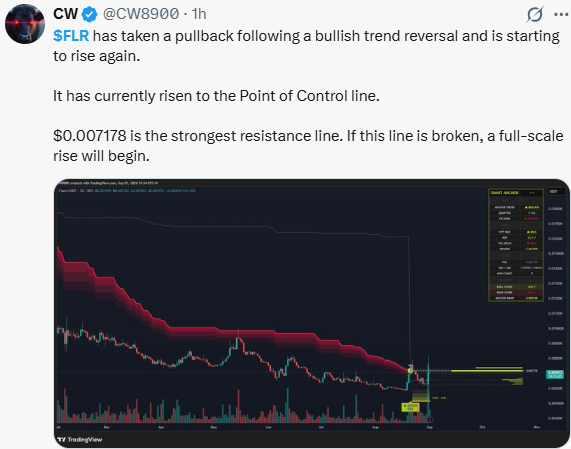
Source: Data From X
A trader on X said FLR pulled back after a bullish trend reversal and is rising again, currently sitting at the Point of Control line (POC, the price level with the heaviest traded volume on the chart's volume profile).
They called $0.007178 the strongest resistance and said a break there could spark a fuller rise.
Note: This is a social media claim, not confirmed data, and CoinGabbar could not independently verify it beyond the trader's own post.
Flare Price Prediction Chart: Technical Analysis
Pair: FLR/USDT · Market: Spot (Crypto index) · Timeframe: 1D · Source: TradingView · Timestamp: September 1, 2026, 11:46 UTC+5:30
FLR is trading at $0.0069667, pulling back after breaking above a multi-month descending trendline in late August.
Price confirmed the breakout and took a pullback from the trendline, then started moving in the same direction as the trend continuation.
Price is at an important level if it holds above the current support, it can move higher.
The EMA cluster sits just below the spot, with the 20 EMAs at $0.0065782 and the 50 EMA at $0.0065548, both now acting as nearby support.
RSI (14) reads 58.00 against its 58.52 average, neutral after cooling off from the rally.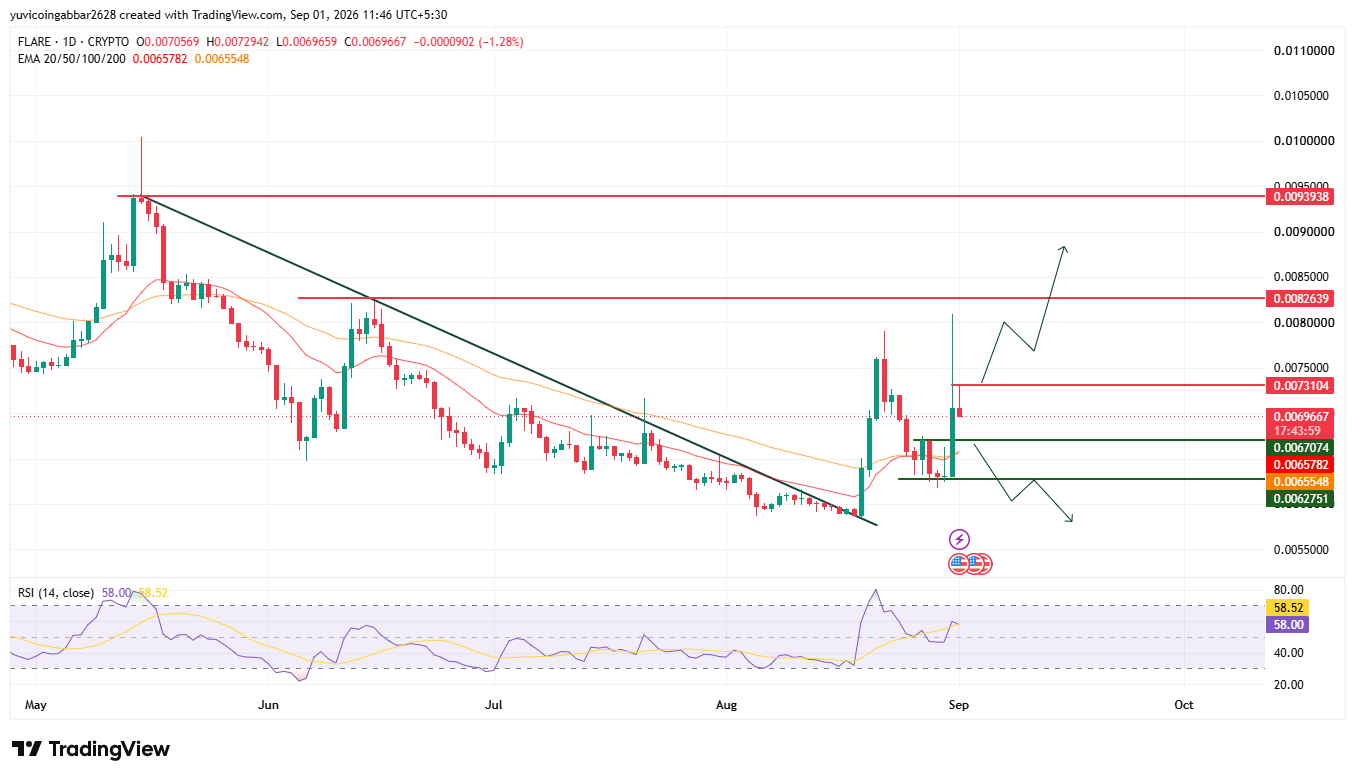
Flare Price Prediction: Key Levels
| Level Type | Price |
| Resistance 3 | $0.0093938 |
| Resistance 2 | $0.0082639 |
| Resistance 1 (nearest) | $0.0073104 |
| Immediate Price Reference | $0.0069667 |
| First Confirmed Support | $0.0067074 |
| Deeper Support | $0.0062751 |
$FLR Forecast: Bull Case vs Bear Case
Bull case: Holding above $0.0067074 and clearing the nearest resistance at $0.0073104 would confirm buyers are stepping back in after the breakout.
A confirmed move there opens the path toward $0.0082639 and eventually $0.0093938.
Bear case: RSI at 58.00 shows the rally has already cooled, and a close below $0.0067074 would put the breakout in question, exposing $0.0062751 next.
$FLR Price Scenarios: Triggers and Invalidation
| Scenario | Trigger | Likely Outcome | Invalidation Point |
| Breakout continuation (bullish) | Daily close above $0.0073104 | Move toward $0.0082639, then $0.0093938 | Close back below $0.0069667 |
| Consolidation (hold) | Price holds between $0.0067074 and $0.0073104 | Range-bound chop before the next leg | Break of either boundary |
| Breakdown (bearish) | Daily close below $0.0067074 | Drop toward $0.0062751 | Reclaim above $0.0067074 |
Can $FLR Reach $0.0093938?
$0.0093938 is the highest resistance marked on the chart.
Getting there would need FLR to first clear $0.0073104, then hold above $0.0082639, a multi-stage move rather than a single leg.
Flare Price Prediction: Expert View
According to CoinGabbar analysts , FLR's pullback looks more like digestion after a sharp move than a reversal, with the EMA cluster holding as support underneath.
$0.0069667 to $0.0073104 is the zone that decides the next leg.
Flare Price Prediction: Data Sources
Price and EMA data referenced from a 1D FLR/USDT chart via TradingView, timestamped September 1, 2026, 11:46 UTC+5:30. Market cap, FDV, volume, and supply data referenced from a crypto market tracker.
Disclaimer
This piece is for informational purposes only and isn't financial advice. The levels and scenarios above are based on technical chart analysis and publicly available data at the time of writing, and crypto markets can move sharply within hours. Do your own research and consider your own risk tolerance before acting on anything discussed here.
Also read:
















