Reason Behind GXT Drop 4.6% as Price Near $0.1: GXT Exchange Recovery?


GXT is down 4.69% today, trading at $0.0996, just under the psychological $0.10 mark.
This GXT Exchange Recovery update sets aside the broader presale-price narrative covered previously and looks specifically at what today's chart, volume, and order book actually show about whether $0.10 can hold.
The Chart Right Now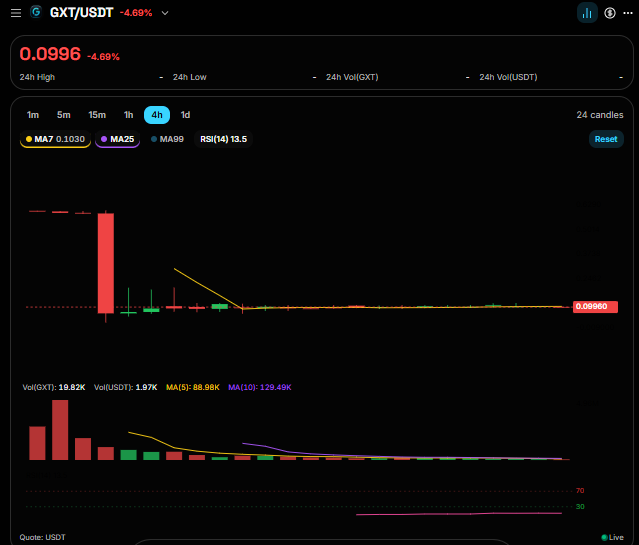
Source: Live GXT/USDT trading interface, captured September 1, 2026
Metric | Value |
Current Price | $0.0996 (-4.69%, 24H) |
MA7 | $0.1030 |
MA25 | Sloping down, above current price |
RSI (14) | 13.5 |
Session-Volume (GXT / USDT) | 19.82K / 1.97K |
MA(5) / MA(10) Volume | 88.98K / 129.49K |
Nearest Ask / Bid | $0.1042 / $0.0996 |
The 4-hour chart shows one large red candle early in the session, a sharp initial sell-off, followed by a flattening pattern with progressively smaller candles as price settled into a narrow band near $0.0996 to $0.1030.
That shape, a sharp drop followed by a flat line, is a specific pattern worth reading carefully rather than treating as simple continued weakness.
Why the 4.69% Drop: Reading the Candle
Why did the GXT price drop 4.69 percent? It started with that first large candle, which did the bulk of today's damage in a single move rather than through sustained, gradual selling.
Everything after it has been comparatively quiet, with small-bodied candles bouncing narrowly between roughly $0.099 and $0.103.
That distinction matters: a single sharp drop followed by flattening looks more like one concentrated selling event finding a temporary floor than an accelerating downtrend.
Why $0.10 Matters Here
Round numbers like $0.10 often act as psychological levels independent of any specific technical justification, simply because traders and automated strategies alike tend to place orders around them.
Is $0.10 a strong support level for GXT? It is worth asking directly: right now, the price sits at $0.0996, a hair below that level, with the nearest meaningful ask liquidity clustering from $0.1042 to $0.1049.
That means reclaiming and holding $0.10 is not just a symbolic milestone; it's the first step toward absorbing the actual resting sell orders sitting just above it.
Volume Says More Than the Percentage Does
This is the most important, and easiest to miss, detail in today's chart. Current session volume (19.82K GXT, 1.97K USDT) sits dramatically below both the 5-period and 10-period-volume moving averages (88.98K and 129.49K respectively).
Whether low momentum suggests stabilization or weak demand does not have a single clean answer: thin-volume during a flat price stretch can mean sellers have exhausted themselves and the market is quietly finding a floor, or it can mean genuine interest, from both buyers and sellers, has simply dried up, with today's percentage move reflects a shallow market moving on light activity rather than a meaningful shift in sentiment in either direction.
What the Order Book Shows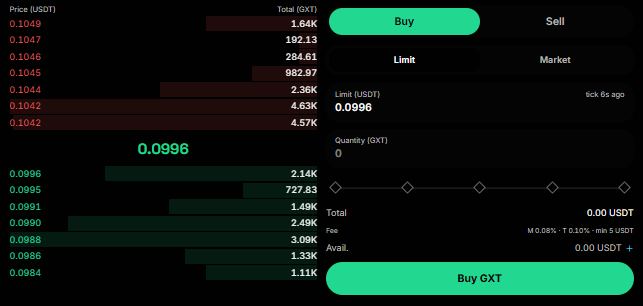
Source: Live GXT order book, captured September 1, 2026
Ask Price | Size (GXT) | Bid Price | Size (GXT) |
$0.1049 | 1.64K | $0.0996 | 2.14K |
$0.1047 | 192.13 | $0.0995 | 727.83 |
$0.1046 | 284.61 | $0.0991 | 1.49K |
$0.1045 | 982.97 | $0.0990 | 2.49K |
$0.1044 | 2.36K | $0.0988 | 3.09K |
$0.1042 | 4.63K | $0.0986 | 1.33K |
$0.1042 | 4.57K | $0.0984 | 1.11K |
Both sides of the book are thin in absolute terms, a pattern consistent with GXT's liquidity profile since launch, but the ask side does show a meaningfully larger size accumulating around $0.1042 to $0.1044 (over 11K GXT combined) compared to the more evenly distributed bid side below the current price.
That concentration of resting sell orders just above $0.10 is a real, near-term obstacle to any recovery attempt, separate from the broader demand question volume-data raises.
Recovery vs. Reversal: What Would Actually Confirm Either
A temporary bounce and a genuine trend reversal look identical on a small timeframe chart; the difference shows up in what happens next.
A real reversal would need volume-returning meaningfully above the current session's levels, ideally approaching or exceeding the 88.98K to 129.49K moving averages, alongside price actually clearing and holding above the $0.1042–$0.1049 ask cluster.
A temporary bounce, by contrast, would likely stall right at that resistance band on similarly thin-volume to today's session, consistent with the broader pattern this token has shown since its multi-exchange rollout began.
GXT Price Prediction: Near-Term Scenarios
Scenario | Price Range | Key Driver | Invalidation |
Bear Case | $0.085–$0.0996 | Renewed selling breaks through the current bid cluster on continued thin volume | A sustained close above $0.0996 would challenge this |
Base Case | $0.0996–$0.115 | Price continues grinding sideways near the psychological $0.10 level without a clear volume-catalyst either direction | Price holding in this range without breaking the ask cluster decisively |
Bull Case | $0.12–$0.15 | Volume-returns meaningfully, clearing the $0.1042–$0.1049 resting ask liquidity and continuing higher | Requires sustained volume above recent moving averages, not a single spike |
GXT Price Prediction: Volume-Confirmation Scenarios
Outcome | Price Range | Key Driver | Invalidation |
Low-Volume Stabilization Persists | $0.095–$0.105 | Today's thin trading (19.82K GXT) continues, price drifts without a decisive move in either direction | A volume-spike in either direction (buy or sell) would break this pattern |
Renewed Selling Breaks the Floor | $0.07–$0.095 | Volume picks up on the sell side, pushing through the current bid cluster toward the next liquidity zone | A volume-backed bounce off $0.095 or below would contradict this |
Genuine Demand Returns | $0.11–$0.14 | Buy-side volume exceeds the 88.98K/129.49K moving averages, clearing resting ask liquidity with follow-through | A failed break that reverts to today's low-volume range would break this |
Disclaimer
Informational purposes only, not financial advice. GXT's current price action reflects a live, thinly traded market where a single large candle can meaningfully move short-term percentage figures. Volume and order book data reflect a specific point-in-time snapshot and can change rapidly. Price prediction ranges above, across both tables, are pattern-based estimates, not guaranteed outcomes. Cryptocurrency carries significant risk of loss.
Also read:
















