INDEX Price Prediction: Is the Upside Just Starting?


$INDEX just lit up the charts. After weeks of grinding sideways in a tight consolidation box, the token has exploded out with a near-vertical push, and that kind of move is exactly why this INDEX Price Prediction is impossible to ignore right now.
Candle after candle is printing higher highs, each one holding firmly above the last swing low, and that's usually the clearest tell that buyers have fully taken over the tape.
What makes this breakout stand out is that it isn't a lone spike on thin volume; it's a sustained push with real participation behind it, which is a very different animal from a quick wick-and-fade.
The real drama, though, is what happens next: can $INDEX keep pushing into the next resistance wall, or does this red-hot momentum need to cool off first? That's the question this INDEX Price Prediction digs into.
Why Is The INDEX Price Up Today?
The numbers here are eye-popping. $INDEX's market cap has rocketed to around $53.38 million, up close to 86.7% in a single 24-hour window, with a fully diluted valuation near $54.43 million, only a hair above the current market cap, meaning there's no big supply overhang waiting to hit the market.
Circulating supply stands at roughly 980.53 million $INDEX out of a 1 billion max, so almost the entire supply is already live, keeping dilution risk low for anyone tracking this INDEX Price Prediction.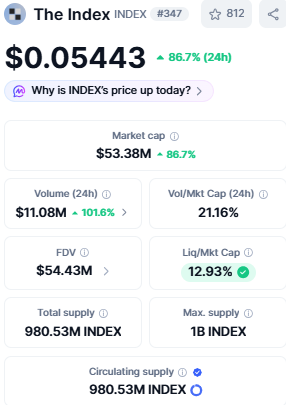
The rally isn't quiet either. According to CoinMarketCap data, 24-hour trading volume has racked up to $11.08 million, more than doubling with a 101.6% jump pushing the volume-to-market-cap ratio to about 21.16%, a strong signal that traders are actually showing up rather than watching thin candles push price around.
Liquidity relative to market cap sits near 12.93% as per the same data, a decent cushion for a token still building out its depth.
Dedicated futures and open interest data specific to $INDEX remain limited since it trades mainly on spot markets, so all this energy around INDEX price today is coming from straight-up spot demand, not leveraged bets.
What Does On-Chain Activity Reveal About INDEX?
Dig under the hood and Robinhood Chain, the network where $INDEX lives, is buzzing too.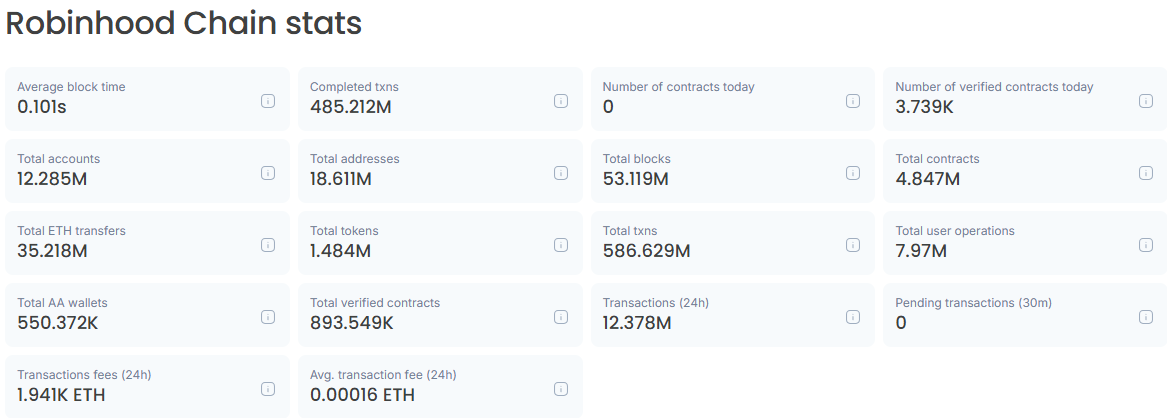
As per the Robinhood Chain block explorer, the network has already pushed through more than 586.629 million total transactions across 12.285 million total accounts, and it's doing that with an average block time of just 0.101 seconds, which is genuinely fast.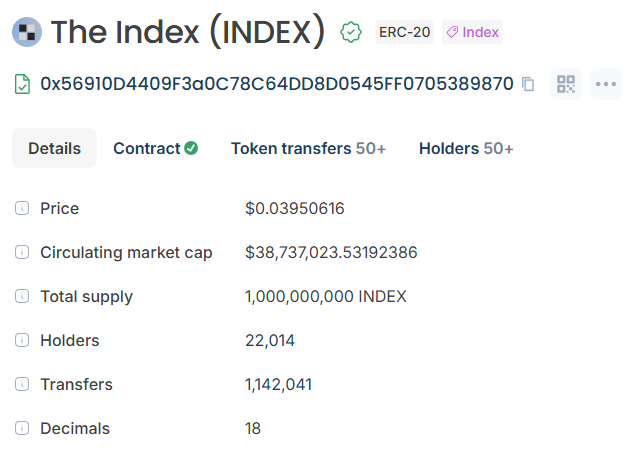
The INDEX token contract itself has crossed 22,014 holders and racked up more than 1.14 million transfers to date.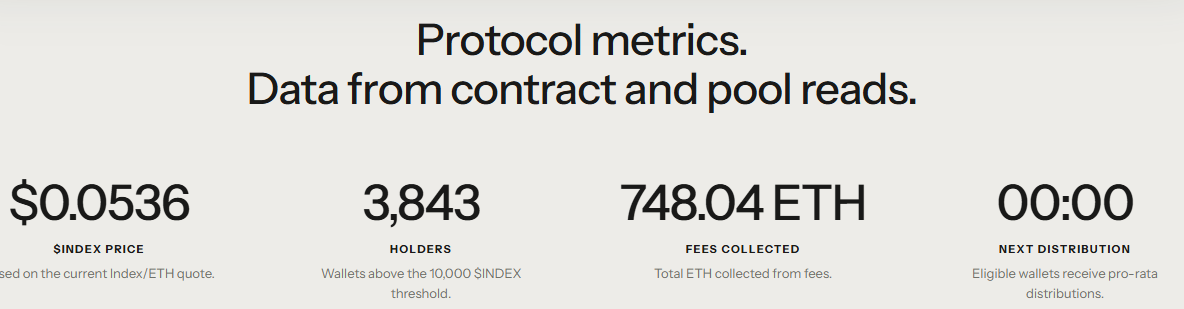
Separately, protocol-level metrics from the project's own dashboard show 3,843 wallets holding above the 10,000 $INDEX threshold, with a healthy 748.04 ETH collected in fees so far and distributed pro-rata to eligible holders.
A growing, active holder base combined with real fee generation is exactly the kind of on-chain signal that points to organic network usage rather than pure hype.
What Could Push INDEX Higher or Pull It Back?
Here's how the setup could play out from here:
Outlook | Trigger | Key Levels |
Bull | Price holds above 0.046812 and continues forming higher highs. | Support at 0.046812; upside can go to 0.100095. |
Neutral | Price consolidates between recent support and resistance without a clear move. | Range between 0.046812 and 0.100095 |
Bear | Price loses the 0.046812 support zone. | Deeper levels at 0.023369 and 0.004380 |
What Is the INDEX Price Chart Signaling Right Now?
The daily chart is where this story really comes alive. $INDEX has ripped out of its consolidation base with a wall of higher-high candles, the kind of pattern that screams momentum.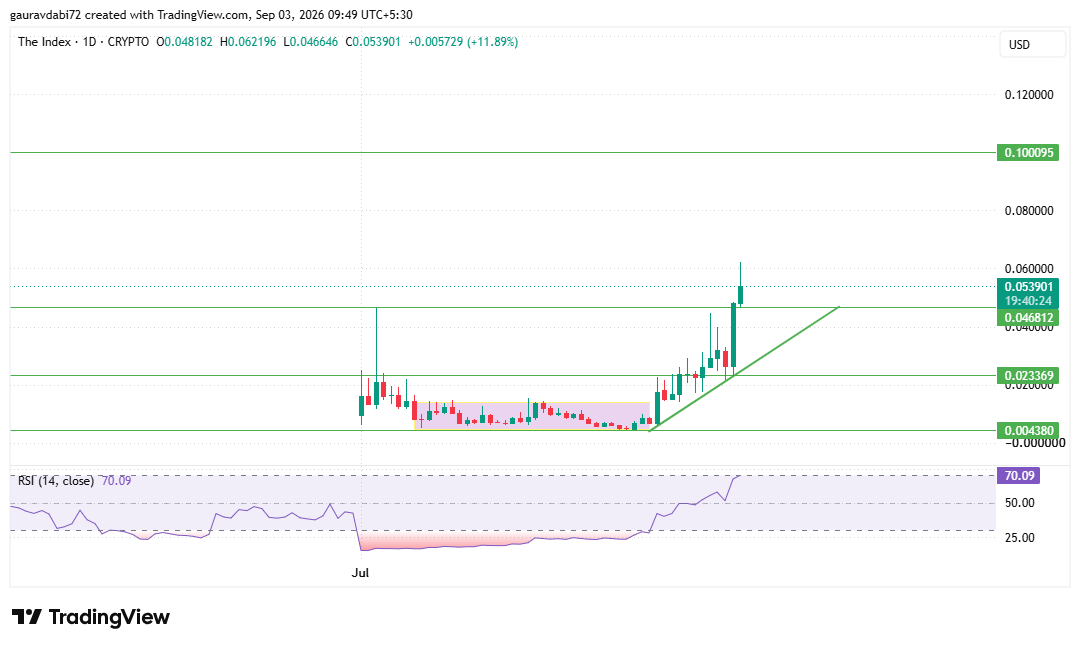
According to the TradingView chart, the Relative Strength Index (14) has surged to near 70.09, firmly into overbought territory, which means momentum is running hot and could pause for breath even though the bigger trend structure still looks intact.
On the downside, the nearest of the $INDEX support and resistance levels sits at 0.046812, with deeper floors at 0.023369 and 0.004380 held over from the earlier consolidation range.
On the upside is where it gets really interesting; 0.100095 is the level that will decide just how far this recovery can run, and price can go to that zone if the current strength keeps up.
Analyst View
Put it all together, and this INDEX Price Prediction describes a token that has gone from dead-quiet consolidation to a genuinely explosive uptrend, and it's got the volume and on-chain activity to back that move up.
As per the CoinGabbar analyst desk, the overbought RSI is the one thing worth watching closely, since momentum this stretched can pause or cool off before it continues, but the structure of higher highs keeps the broader setup constructive as long as the 0.046812 support zone holds firm.
Disclaimer: This article is for informational purposes only and does not constitute financial, investment, or trading advice. Cryptocurrency markets are highly volatile and unpredictable; readers should conduct their own research before making any decisions. CoinGabbar and the author bear no responsibility for losses incurred based on this content.
Also read:
















