90% Will Miss Mantle Price Prediction Sept 2026 – Big Move Coming?


There is a moment in every downtrend when the story quietly starts to change, long before the headlines catch up and Mantle looks like it might be living through that moment right now.
For months, Mantle price prediction was a token that traders mentioned with a shrug, another chart sliding lower while the rest of the market moved on.
But somewhere in the last few weeks, the tape started whispering something different.
Buyers showed up where sellers used to win. Support that had been tested and broken before suddenly held.
And now, heading into September 2026, the question on every trader's mind isn't whether Mantle bounced; it's whether this bounce has legs.
This $MNT walks through that story: what the charts are showing, what the derivatives desks are doing, and where the next chapter for MNT could realistically go.
Mantle Market Snapshot
According to CoinMarketCap data, right now, MNT is trading close to $0.52, carrying a market capitalization of roughly $1.71 billion and holding rank #43 in the broader crypto market, a position that keeps it firmly on the radar of traders scanning for the next mid-cap move.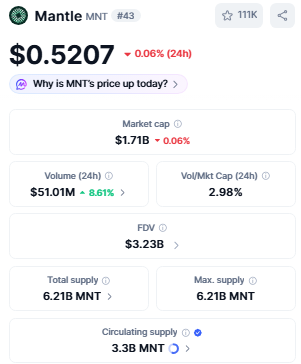
Its fully diluted valuation sits near $3.23 billion, a number worth noting because only 3.3 billion of its eventual 6.21 billion total and max supply are in circulation today, meaning the story of Mantle's supply is still only half told.
Trading desks have kept busy too, with 24-hour volume near $51.01 million translating into a volume-to-market-cap ratio of almost 2.98%, healthy enough to suggest this isn't a quiet, forgotten chart.
Even the network tells a tale of quiet persistence, with cumulative transactions on Mantle's base layer having now crossed the 294 million mark.
It's this foundation that any serious Mantle price prediction has to be built on.
Performance & Derivatives: Reading the Room
Step back far enough, and Mantle's chart looks like a token fighting its way out of a long, cold winter.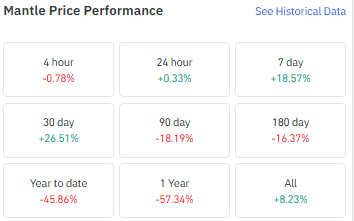
The past 7 days have brought a strong 18.57% rally, and the 30-day gain sits even higher at 26.51%, numbers that explain why MNT is suddenly back in trading-desk conversations.
But zoom out further and the picture turns more cautious: MNT is still down 18.19% over 90 days, down 16.37% across 180 days, and sitting nearly 45.86% lower on a year-to-date basis, a reminder that this recent strength is unfolding inside a much bigger downtrend, not outside of it.
Over a full year the pair remains down 57.34%, though it is still up 8.23% since its earliest tracked data, proof that the longest-term holders haven't been left completely underwater.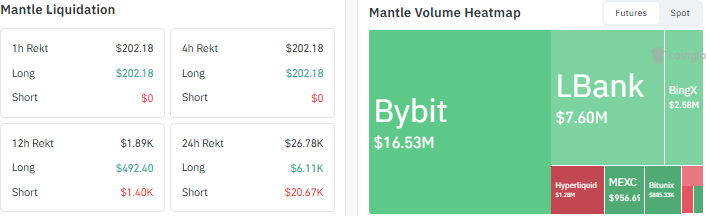
The derivatives market is telling its own version of this story. According to CoinGlass data, 24-hour futures volume has been dominated by Bybit at close to $16.53 million, with LBank near $7.60 million and BingX around $2.58 million adding to the mix, while smaller flows moved through HyperLiquid, MEXC, and Bitunix.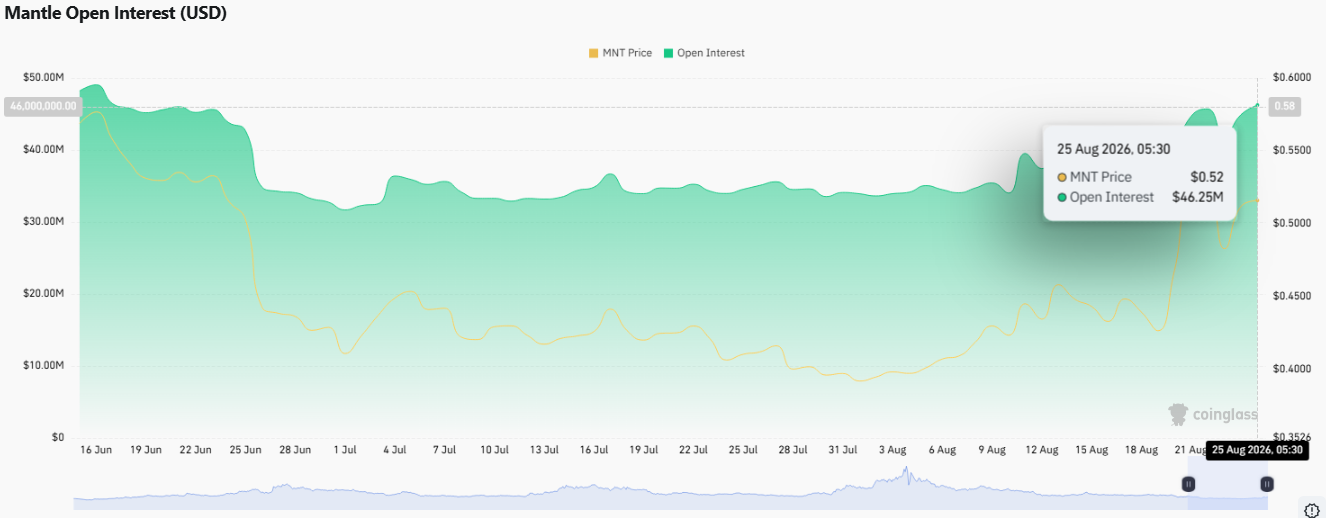
Open interest, per the same data, has held remarkably steady near $46.25 million as of August 25, 2026, even as spot price climbed, a sign that positioning hasn't gotten euphoric just yet.
Liquidations stayed light too, with roughly $26.78K wiped out over 24 hours, split between about $6.11K in longs and $20.67K in shorts, hinting that it was short-sellers, not late-buying longs, who were caught wrong-footed during the recent push higher.
Taken together, this is the backdrop shaping the near-term Mantle price prediction.
Weekly Chart: A Structure Still Proving Itself
Zoom into the weekly timeframe, and according to the TradingView chart, Mantle has done something it hasn't managed in a while: it has pushed above the descending channel that had capped its price for months.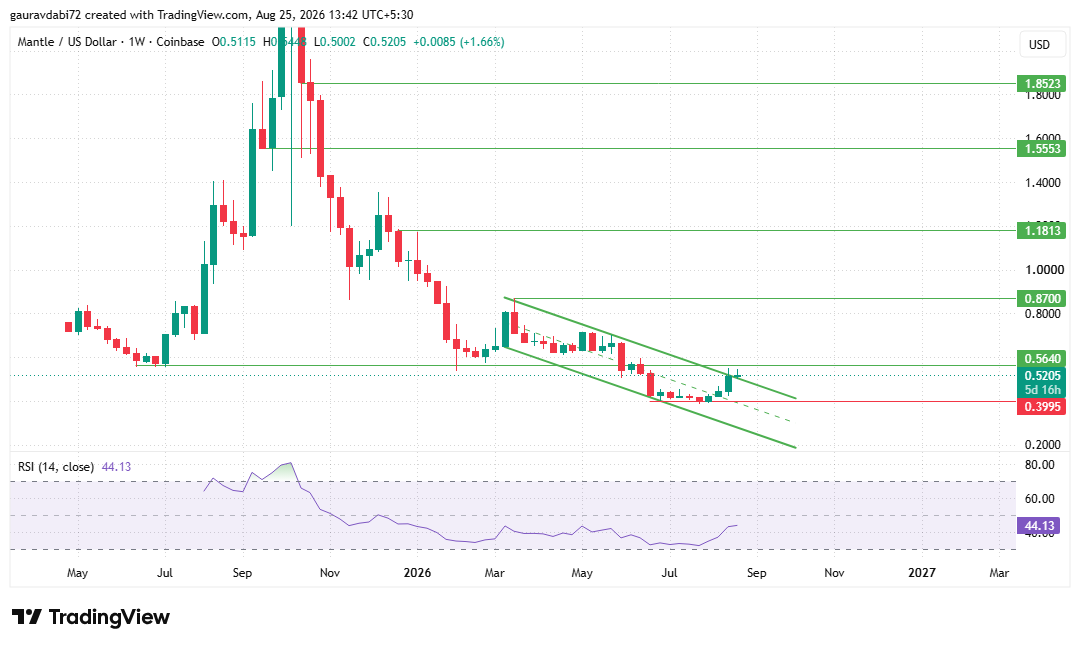
It's a meaningful move, but as per CoinGabbar analyst reading of the setup, it isn't a confirmed one yet; the market needs a weekly candle to actually close above that zone before this gets treated as a genuine structural shift rather than a temporary spike.
Until then, this is very much a wait-and-watch chapter. Resistance sits close by at $0.5640, with bigger tests waiting further up the chart at $1.1813, $1.5553, and $1.8523.
On the flip side, if the bulls lose their grip, the deeper cushion lies near $0.3995, and a neutral market could simply keep drifting between $0.3995 and $0.5640 for a while.
The weekly RSI at 44.13, still under the midline, suggests momentum has some convincing left to do before this turns decisively bullish.
Daily Chart: The More Hopeful Timeframe
The daily chart, by contrast, reads like a more confident version of the same story.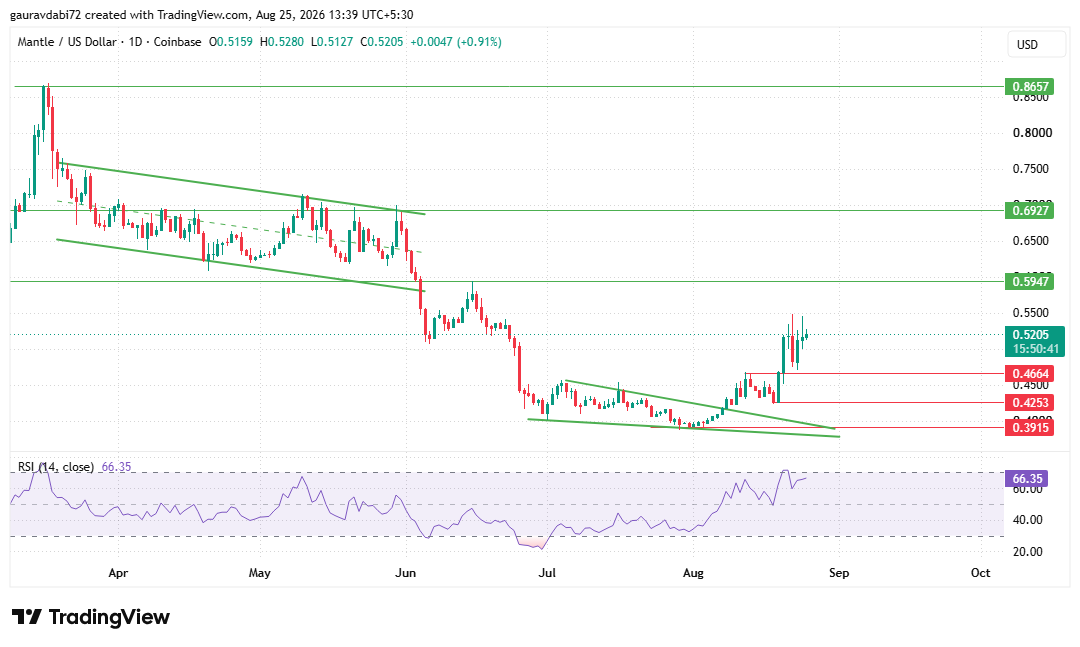
Mantle has broken out of a falling wedge pattern and, more importantly, has come back to retest its support zone several times without giving it up, the kind of behavior chart-watchers often associate with continuation rather than exhaustion.
Resistance isn't far away at $0.5947, with $0.6927 and $0.8657 waiting as the next checkpoints if buyers keep pushing.
Support has formed in layers at $0.4664, $0.4253, and a deeper floor at $0.3915. If the market stays neutral from here, the price is likely to keep dancing between $0.4664 and $0.5947.
The daily RSI at 66.35 is leaning toward overbought, a fair reflection of just how sharp the recent rally has been.
Mantle Price Prediction Sept 2026: Bull, Bear & Neutral Scenarios
Bring the weekly and daily stories together, and three distinct paths open up for the Mantle price prediction heading into September 2026:
Scenario | Key Levels | Outlook |
Bullish | Weekly close above $0.5640, then $1.1813, $1.5553, $1.8523 | Sustained buying could open the door for MNT to test the higher resistance bands step by step. |
Bearish | Break below $0.3915 (daily) / $0.3995 (weekly) | A breakdown of these zones could drag the price back toward deeper support levels. |
Neutral | $0.4664–$0.5947 (daily) / $0.3995–$0.5640 (weekly) | Price likely continues to range-trade until a decisive breakout or breakdown occurs. |
What Is the Mantle Community Talking About?
The charts aren't the only place Mantle is generating buzz. On X, Mantle's official account recently dropped a cryptic teaser talking of a "new vault" being unlocked, with a promise that "tomorrow, you hold the keys.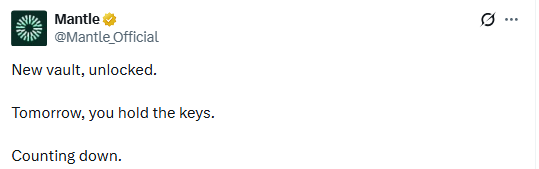
"It's the kind of countdown language that crypto communities tend to seize on, and paired with the current technical setup, it's added a fresh layer of anticipation to the Mantle price prediction Sept 2026 conversation playing out across trading groups and social feeds.
Disclaimer: This article is for informational purposes only and does not constitute financial, investment, or trading advice. Cryptocurrency markets are highly volatile and unpredictable; readers should conduct their own research before making any decisions. CoinGabbar and the author bear no responsibility for losses incurred based on this content.

















