PAX Gold Price Prediction: Whales Control $1.7B Supply, What Next Gold


PAX Gold just won't slow down. PAXG is up 2.5% today near $4,577.56, and gold-backed demand is fueling fresh momentum after months of quiet consolidation.
This PAX Gold Price Prediction looks at whether the rally has more room to run or whether this is the moment to watch closely before it cools off.
Market data was checked on August 21, 2026, at 16:45 IST.
PAX Gold Price Prediction Today: Market Overview
Metric | Value |
Price | $4,577.56 |
24h Change | +2.5% |
Market Cap | $2.01B |
24h Change (Market Cap) | +2.5% |
24h Volume | $291.7M+ |
24h Change (Volume) | -28.34% |
Vol/Mkt Cap (24h) | 14.22% |
FDV | $2.01B |
Liq/Mkt Cap | 1.09% |
Total Supply | 438.95K PAXG |
Max Supply | Unlimited |
Circulating Supply | 438.95K PAXG |
Holders | 86.04K |
Source: Data from CoinMarketCap as of August 21, 2026, at 16:45 IST. Figures may vary slightly across other tracking websites.
PAX Gold Liquidation and Volume Data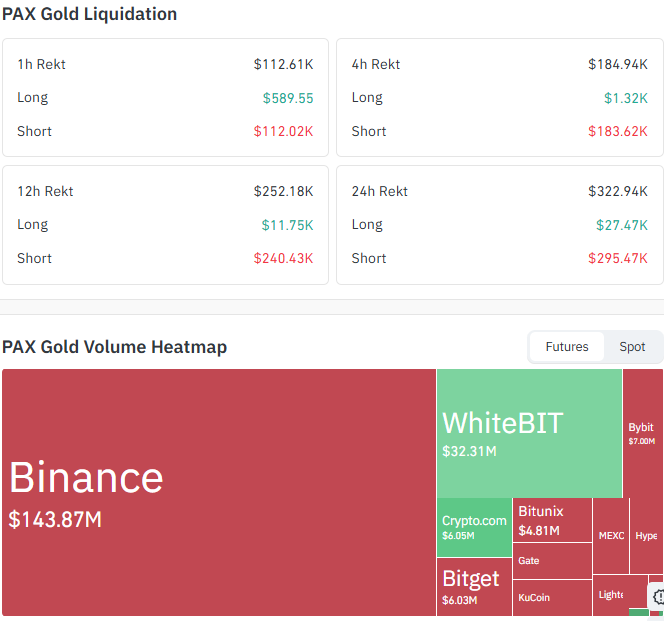
Source: Data From CoinGlass
Liquidations (Coinglass, Futures)
Timeframe | Total | Long | Short |
1h | $112.61K | $589.55 | $112.02K |
4h | $184.94K | $1.32K | $183.62K |
12h | $252.18K | $11.75K | $240.43K |
24h | $322.94K | $27.47K | $295.47K |
Exchange Volume (Futures)
Exchange | Volume |
Binance | $143.87M |
WhiteBIT | $32.31M |
Bybit | $7.00M |
Crypto.com | $6.05M |
Bitget | $6.03M |
Bitunix | $4.81M |
Short liquidations have overwhelmed longs in every window, especially the 4h and 24h windows, showing shorts getting squeezed as price pushed toward recent highs.
PAXG Holder Distribution
Tier | Holder Count | % of Holders | % of Market Cap |
Whale | 1,859 | 2.16% | 86.82% |
Shark | 6,554 | 7.61% | 10.47% |
Dolphin | 12,411 | 14.42% | 2.38% |
Fish | 16,389 | 19.04% | 0.29% |
Crab | 13,900 | 16.15% | 0.03% |
Shrimp | 34,970 | 40.62% | <0.01% |
Whale wallets make up just 2.16% of holders but control 86.82% of PAXG's market cap, showing supply is heavily concentrated at the top.
The top 100 wallets alone hold 56.65% of supply, with the top 10 holders controlling 33.81% on their own.
The Gini score of 0.9771 confirms this skew, with 11 holders each owning at least 1% of total supply.
This kind of concentration means large wallet moves can swing the price more than usual, so it's worth watching alongside the technical levels of gold price prediction.
PAXG Price Prediction Chart: Technical Analysis
Pair: PAX Gold/USD · Market: Spot (Crypto) · Timeframe: 1D · Source: TradingView · Timestamp: August 21, 2026, 14:45 UTC+5:30
PAX Gold price today is trading at $4,577.56, continuing a steady climb off the early August lows near $4,000 after breaking above the resistance zone that had capped it for weeks.
RSI (14) sits at 71.84, an overbought reading that shows the rally has been strong and fast.
The EMA cluster sits well below current price, with the shorter EMA 20 at $4,350.24 and the longer EMA 50 at $4,256.24, both now acting as deeper support beneath the move.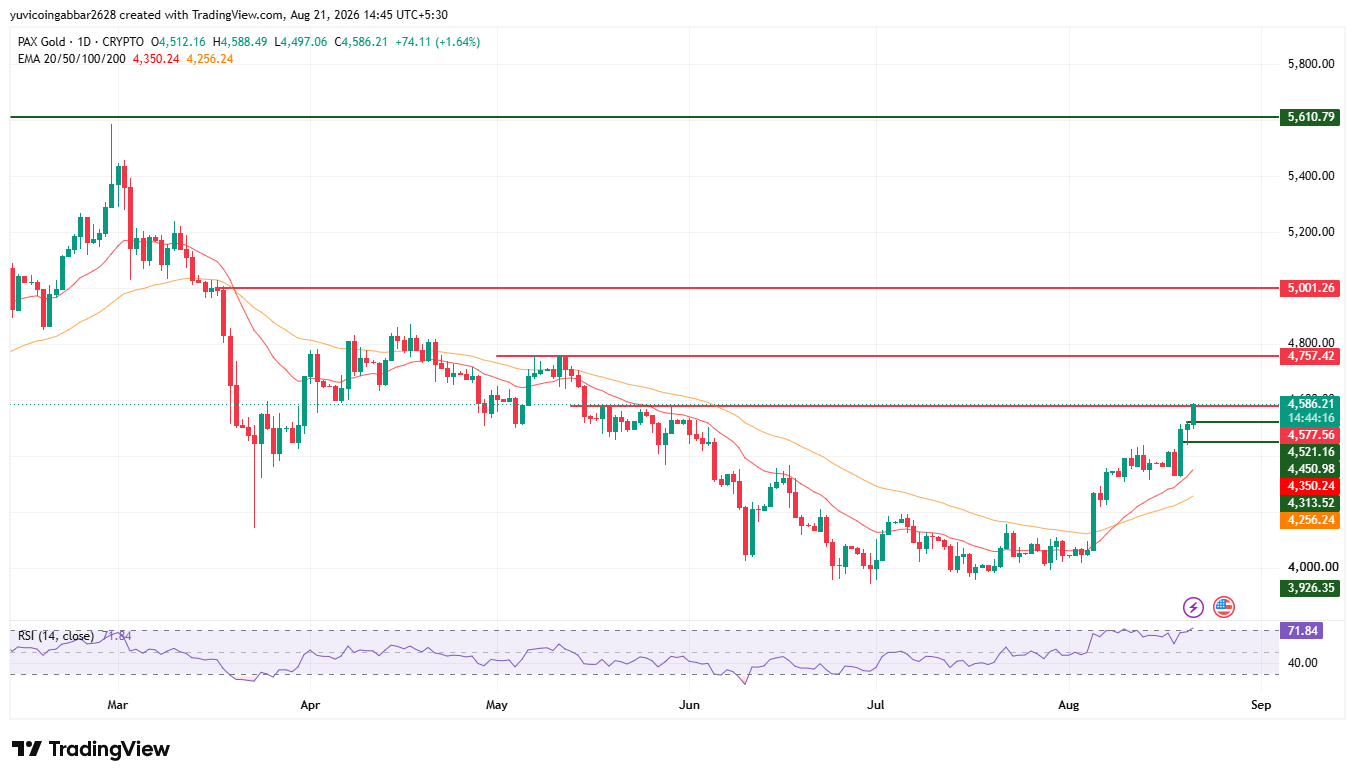
Important Levels
Level Type | Price |
Resistance 3 (major) | $5,610.79 |
Resistance 2 | $5,001.26 |
Resistance 1 (nearest) | $4,757.42 |
Immediate Price Reference | $4,577.56 |
Support 1 (nearest) | $4,521.16 |
Support 2 (deeper) | $4,450.98 |
EMA Levels
EMA | Price |
EMA 20 | $4,350.24 |
EMA 50 | $4,256.24 |
PAX Gold Forecast: Bull Case vs Bear Case
PAXG price target 2026 Bull case: Holding above $4,521.16 and the EMA cluster near $4,256.24 to $4,350.24 keeps the recovery structure intact.
A confirmed close above $4,757.42 would open the path toward $5,001.26 and eventually the major resistance at $5,610.79.
PAXG price target 2026 Bear case: RSI near 72 signals the move is stretched, and a cooldown toward $4,521.16 or the EMA cluster would not be unusual.
Losing $4,450.98 would put the recovery in doubt and expose a deeper downside toward the EMA zone.
Price Scenarios: Triggers and Invalidation
Scenario | Trigger | Likely Outcome | Invalidation Point |
Range hold | Price stays above $4,521.16 | Push toward $4,757.42 | Close below $4,521.16 |
Resistance breakout | Close above $4,757.42 | Move toward $5,001.26, then $5,610.79 | Rejection back below $4,577.56 |
Pullback | RSI cools from 71.84 | Retest of support at $4,521.16, then $4,450.98 | Break below $4,450.98 |
PAXG price target: Can PAXG Reach $5,610.79?
$5,610.79 is the highest resistance marked on the chart.
Reaching it would require PAXG to first clear $4,757.42, then $5,001.26, a multi-stage move rather than a single leg.
Gold Price Prediction 2026: Expert View
According to CoinGabbar analysts, PAXG has climbed steadily since early August, and today's move comes with heavy short liquidations, suggesting shorts are getting caught offside as price grinds higher.
RSI at 71.84 leaves the setup stretched, so some cooling near current levels wouldn't be a surprise.
The $4,521.16 zone is the key level to watch: holding it keeps the bullish structure alive, while losing it would suggest the rally needs to reset before its next leg.
Disclaimer
This piece is for informational purposes only and is not financial advice. The levels and scenarios above are based on technical chart analysis and publicly available data at the time of writing. Crypto markets can move sharply within hours, so past patterns do not guarantee future outcomes. It is worth doing independent research and considering your own risk tolerance before acting on any of the levels discussed here.
Also read:











.webp)





