RBLK Crash 41%! Golden Chance For Buyers: Rollblock Price Prediction


By Crypto Markets Analyst. Reviewed by the Crypto Markets Editor. Data captured from the RBLK live price dashboard, August 13, 2026.
RBLK has crashed 41.79% over the past week to $0.000824, sitting just 0.6% above its 52 week low of $0.000819.
This Rollblock price prediction checks whether that proximity to a multi-month floor makes today a genuine accumulation opportunity or simply a token still finding its bottom, using the actual chart structure and volume data rather than the "golden chance" framing alone.
Key Takeaways
RBLK down $0.00059 (41.79%) over the past week (Aug 7–13), now trading at $0.000824
The current price sits just $0.000005 above its 52 week low of $0.000819
Daily-volume of $722.29 remains thin relative to an $821.5K FDV
RBLK Stats Snapshot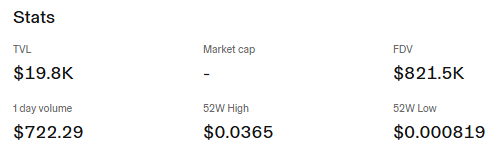
Source: RBLK live price dashboard, captured August 13, 2026
Metric | Value |
Current Price | $0.000824 |
Contract | 0x3F3e...D6f9 |
TVL | $19.8K |
Market Cap | Not available (unreported circulating supply) |
FDV | $821.5K |
1-Day-Volume | $722.29 |
52-Week High | $0.0365 |
52-Week Low | $0.000819 |
The 1-Week Chart: A Sustained Breakdown, Not a Flash Crash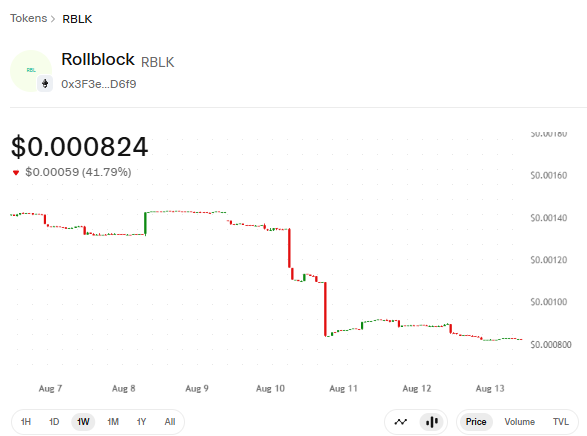
Source: RBLK 1W price chart by Uniswap, captured August 13, 2026
The 1W chart shows RBLK holding relatively flat between roughly $0.00130 and $0.00140 from Aug 7 through Aug 9, before a sharp breakdown begins around Aug 10. Price falls in stages from that $0.0013-$0.0014 zone down to about $0.00082 by Aug 13, a drop of $0.00059, or 41.79%, across the full week.
That is a genuine multi-session decline rather than a single-day event, which matters for how the move should be read: sustained selling pressure spread over three to four days, not one thin-liquidity spike.
The 1-Day Chart: Signs of Stabilization Near the Low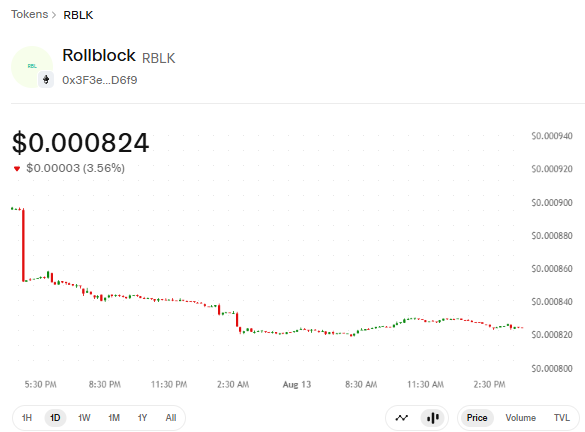
Source: RBLK 1D price chart by Uniswap, captured August 13, 2026.
The 1D chart tells a narrower story than the weekly view. After an initial sharp drop early, RBLK has spent most of the past 24 hours consolidating in a tight $0.000800-$0.000840 band, down just $0.00003 (3.56%) on the day itself.
The steep part of the crash visible on the 1W chart has already played out; today's price action looks more like consolidation than continued freefall, though 24 hours of tight range trading is not yet strong confirmation of a bottom.
Is $0.000824 Actually a Support Level?
RBLK's current price sits almost exactly on its 52-week low of $0.000819, a gap of just $0.000005, or roughly 0.6%.
That makes this zone the most significant technical reference point available: it's either about to hold as genuine support, or a break below it would put RBLK into new 52-week-low territory with no historical floor to reference on the available chart.
The past 24 hours of tight consolidation between $0.0008 and $0.00084 is consistent with the market testing this level rather than resolving decisively in either direction yet.
Golden Chance or Still Falling: What the Volume Says
At just $722.29 in daily volume against an $821.5K FDV, roughly 0.09% of FDV traded today, RBLK's current activity is thin enough that neither a strong reversal nor a further breakdown would require much capital to trigger.
This is the central risk in calling the current level a "golden chance": genuine accumulation would typically show rising volume alongside price stabilization, and that has not yet appeared in the available data.
The flat 1D chart is a necessary first sign of a bottom forming, but it is not sufficient confirmation on its own.
Rollblock Price Prediction: Bear, Base, Bull
This RBLK Price Prediction uses the current $0.000824 price, the 52-week range ($0.000819–$0.0365), and this week's 41.79% crash pattern as its basis. RBLK's chart contains no separately marked technical support or resistance levels beyond the 52-week range itself.
Scenario | Estimated Price Range | Change vs. $0.000824 | Key Driver | Invalidation |
Bear Case | $0.00060–$0.00078 | -27%–(-5%) | The 52-week low breaks decisively, thin volume fails to absorb further selling | A confirmed close below $0.000819 on rising volume would confirm this |
Base Case | $0.00080–$0.00095 | -3%–+15% | Price holds within the current consolidation band near the 52-week low | Sustained trading in the $0.0008–$0.00095 range over several sessions |
Bull Case | $0.0011–$0.0015 | +33%–+82% | Volume increases meaningfully, price reclaims the pre-crash $0.0013–$0.0014 zone | Requires a confirmed break back above $0.0011 with rising volume |
Rollblock Price Prediction: What Would Confirm "Buying Chance" Thesis
A second angle worth separating from the near-term table above: What evidence would actually validate the golden-chance narrative rather than assume it?
Signal | Current Status | What Would Confirm It |
Volume trend | $722.29/day, thin relative to FDV | A sustained rise above $2,000–$3,000/day alongside price stability |
Price vs. 52-week low | Just 0.6% ($0.000005) above $0.000819 | A confirmed hold above this level for multiple consecutive sessions |
TVL trend | $19.8K, no comparison data available this update | Growth in TVL alongside price stabilization |
Reclaim of pre-crash range | Price remains ~41% below the Aug 7-9 $0.0013-$0.0014 zone | A confirmed breakout back above that zone on rising volume |
Rollblock Price Prediction: 30-Day Outlook
A third view extends beyond the immediate consolidation to what a longer stretch could look like, built from the same 52-week range and current volume trend rather than a technical forecast.
Scenario | Estimated Price Range | Change vs. $0.000824 | Key Driver |
Bear Case | $0.00045–$0.00065 | -45%–(-21%) | Volume stays below $1,000/day for multiple weeks, no reversal catalyst appears, price grinds toward a new 52-week low |
Base Case | $0.00075–$0.0011 | -9%–+33% | Price stabilizes near current levels with gradual volume recovery over the coming weeks |
Bull Case | $0.0018–$0.0028 | +118%–+240% | Sustained volume increase draws RBLK back toward its pre-crash range and beyond; renewed buyer interest confirmed over multiple weeks |
Risks Worth Naming
RBLK's market cap remains unavailable due to unreported circulating supply, and no audit, team identity, or tokenomics disclosure appears in the available dashboard data.
The proximity to the 52-week low, just $0.000005 away, is a meaningful technical reference point, but at $722.29 in daily volume, a small number of trades could move price sharply in either direction, meaning today's consolidation should not be read as confirmed stabilization.
All price ranges above, across all three tables, are pattern-based estimates, not guaranteed outcomes.
Glossary
52-Week Low: The lowest price a token has traded at over the past year; RBLK's current price of $0.000824 sits just $0.000005 above its $0.000819 low.
FDV (Fully Diluted Valuation): A token's theoretical market cap if its entire max supply were in circulation at the current price, $821.5K for RBLK.
Disclaimer
Informational purposes only, not financial advice. RBLK's market cap remains unavailable due to unreported circulating supply. Price prediction ranges above, across all three tables, are pattern-based estimates derived from chart, volume, and 52-week range data, not confirmed technical levels or guaranteed outcomes. RBLK trades in a low-liquidity environment. Verify all data independently before making any decisions.

















