Shiba Inu Price Prediction: $SHIB Make-or-Break Level, Watch Key Level


Shiba Inu is one of the largest meme coins, with long periods of silence followed by an unexpected rise that takes everyone by surprise.
Right now, this Shiba Inu Price Prediction looks at a chart that's sitting right at a decision point.
SHIB has been squeezed into a tight falling channel for days, and the price is hovering just above a support line that's held twice already.
A break either way here could set the tone for the next couple of weeks, so this is exactly the kind of setup worth watching closely.
Market data was checked on August 17, 2026, at 10:49 IST.
Shiba Inu Price Prediction Today: Market Overview
Metric | Value |
Price | $0.000004443 |
24h Change | -2% |
Market Cap | $2.61B |
Unlocked Market Cap | $2.61B |
FDV | $2.61B |
24h Volume | $43.85M |
Vol/Mkt Cap (24h) | 1.67% |
Liquidity/Mkt Cap | 0.15% |
Total Supply | 589.49T SHIB |
Max Supply | 589.55T $SHIB |
Circulating Supply | 589.23T $SHIB |
Holders | 3.07M |
Source: Data from CoinMarketCap as of August 17, 2026, at 10:49 IST. Figures may vary slightly across other tracking websites.
SHIB Price Prediction Chart: Technical Analysis
Pair: SHIB/USDT · Market: Spot (Crypto) · Exchange: KuCoin · Timeframe: 4H · Source: TradingView · Timestamp: August 17, 2026, 10:49 UTC+5:30
SHIB is trading at $0.000004443, and the price has been dipping lower since early August, and for the last few days it's been stuck inside a falling channel, marked on the chart by two downward-sloping lines running side by side.
Inside that channel, price keeps testing the lower line and bouncing slightly, but it hasn't managed a real push higher yet.
SHIB is also sitting below both EMA (Exponential Moving Average, a line that tracks the average price over time, weighted toward recent candles) lines, with the EMA 20 at $0.000004497 and the EMA 50 at $0.000004543, both sitting just above the current price.
That puts SHIB in a tight spot: squeezed between a channel that keeps pushing it down and a support line just below that keeps catching it.
If the price breaks the channel to the upside and holds the $0.000004376 support, we could see a rise.
If it breaks below the current support, we could see more downside. 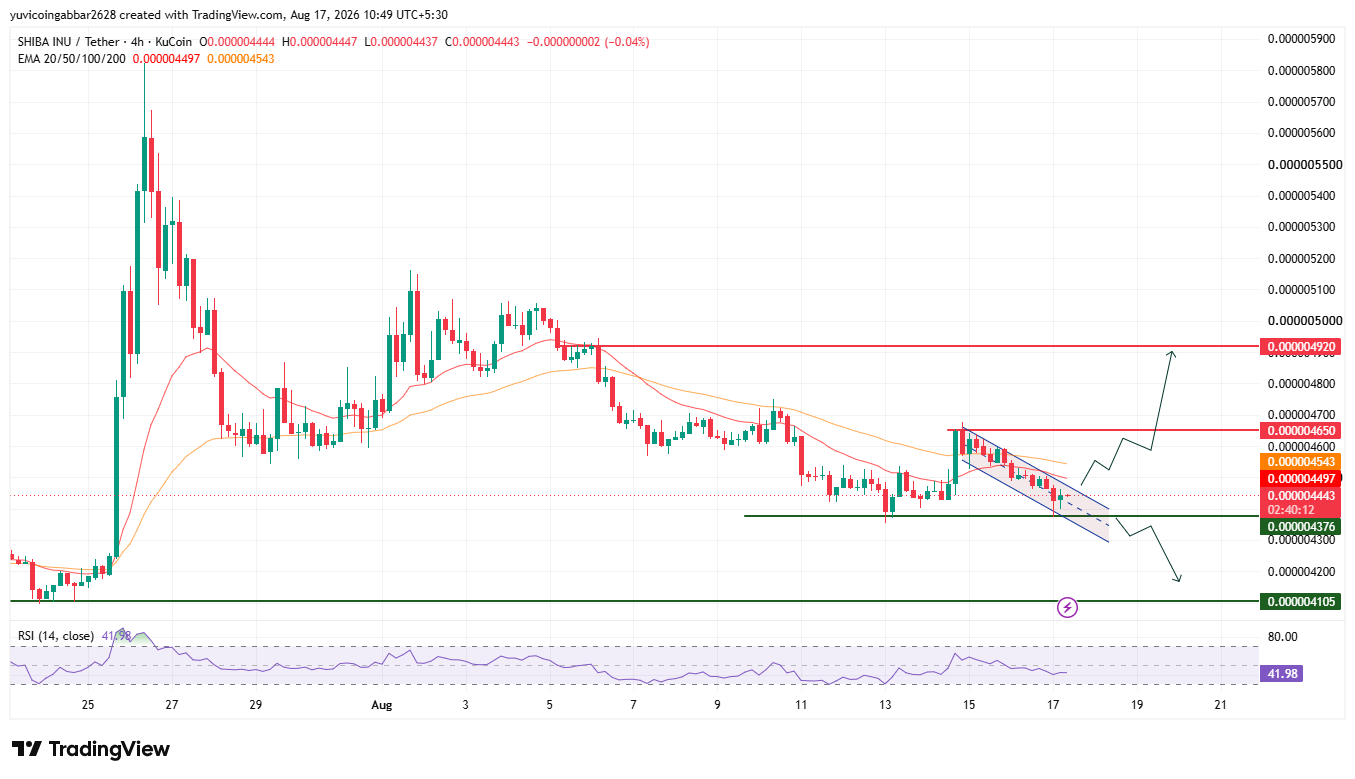
Support and Resistance Levels
Level Type | Price |
Resistance 2 | $0.000004920 |
Resistance 1 (nearest) | $0.000004650 |
Immediate Price Reference | $0.000004443 |
First Support | $0.000004376 |
Structural Floor | $0.000004105 |
EMA Levels
EMA | Price |
EMA 20 | $0.000004497 |
EMA 50 | $0.000004543 |
$Shiba Inu Forecast: Bull Case vs. Bear Case
$SHIB price target 2026 Bull case: Holding above $0.000004376 keeps $SHIB inside the current range and gives it a shot at breaking out of the falling channel.
A clean move above $0.000004650 would confirm the channel is broken, opening the door toward $0.000004920.
$SHIB price target 2026 Bear case: $SHIB has already tested $0.000004376 more than once, and each retest raises the odds of it eventually failing.
A close below that level would confirm the channel breakdown and put the structural floor at $0.000004105 in play, with nothing else marked on the chart to slow the drop before that.
SHIB Price Scenarios: Triggers and Invalidation
Scenario | Trigger | Likely Outcome | Invalidation Point |
Trendline reclaim | SHIB closes above $0.000004650 | Channel breakout, move toward $0.000004920 | Rejection at $0.000004650 |
Channel hold | Price stays above $0.000004376 | Continued sideways range inside the channel | Close below $0.000004376 |
Channel breakdown | Price closes below $0.000004376 | Drop toward the $0.000004105 structural floor. | Reclaim of $0.000004376 |
SHIB Price Target: Can SHIB Reach $0.000004920?
$0.000004920 is the highest resistance level marked on the chart.
To get there, SHIB would first need to break out of the falling channel above $0.000004650, then clear both EMA lines sitting just overhead.
That's a couple of steps away from where price is trading now, not a move that happens in a single candle.
What Could Invalidate the Bullish Setup?
A rejection right at the EMA cluster near $0.000004497 to $0.000004543 followed by a close back below $0.000004376 would confirm the channel is still in control and the bounce attempt has failed.
A further break below the $0.000004105 structural floor would signal the downtrend has more room to run.
$Shiba Inu Price Prediction: Expert View
According to CoinGabbar analysts, $SHIB is stuck in a spot a lot of meme coin traders will recognize: a slow decline lower inside a falling channel, with price repeatedly testing the same support line without a clean break either way.
Sitting below both EMA lines doesn't help the bull case, since any bounce has to fight through overhead resistance rather than ride momentum.
The $0.000004376 level is doing a lot of work right now.
Hold it again, and SHIB stays in this range a while longer. Lose it, and the $0.000004105 floor becomes the next real test.
Disclaimer: This piece is for informational purposes only and isn't financial advice. The levels and scenarios above are based on technical chart analysis and publicly available data at the time of writing, and crypto markets can move sharply within hours, so past patterns don't guarantee future outcomes. It's worth doing independent research and considering your own risk tolerance before acting on any of the levels discussed here.
Also read:













.webp)








