StonkBroker Price Prediction: Can STONKBROKER Reclaim $0.03 Again?


A sudden burn event and a marketing rewards drop just flipped the mood around this Robinhood Chain token. Traders want to know if the move has real legs or fades like the last one.
StonkBroker Price Prediction: Can It Hit $0.03 Again? Key Levels
StonkBroker price prediction chatter picked up fast this week, and it is not hard to see why.
This is a memecoin built on Robinhood Chain, a newer network chasing the retail trading crowd, and it just had a loud few days.
A chunk of its supply got burned. Marketing rewards went out to holders. And the community reacted the way meme communities do: fast, loud, and a little chaotic.
Here's the thing: StonkBroker is not new to big swings. It climbed thousands of percent off its summer lows, then dropped hard from its peak two weeks later.
So which version shows up next, the one that rips or the one that rolls over? We dug into the chart, the on-chain numbers, and the latest catalyst to find out.
Latest Price Action and Market Reaction
Data snapshot, as of 09:30 UTC on August 24, 2026
StonkBroker (STONKBROKER) trades near $0.0180, up more than 31% in the past twenty-four hours, according to CoinMarketCap data.
Market cap sits around $21.6 million, up about the same amount, while trading volume hit $4.97 million, a jump of over 40%.
Fully diluted value stands at $44.06 million against that $21.6 million market cap, and only about half the total supply is circulating right now.
Anyone who followed the recent Robinhood Chain rally already knows this token does not do small moves.
Why StonkBroker Price Is Moving Today
The catalyst here is not a rumor. It is a tokenomics move.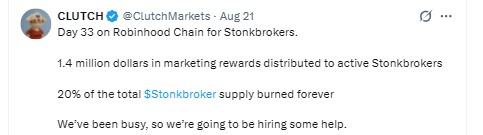
On August 21, Clutch Markets confirmed $STONKBROKER crossed Day 33 on Robinhood Chain. The team distributed 1.4 million dollars in marketing rewards to active holders, and 20% of the total $STONKBROKER supply got burned forever.
Turns out, the team also hinted at hiring, a signal the project plans to stick around.
Upcoming distributions and burns like this one tend to show up first on a token's coin events calendar, worth a bookmark.
But burns and rewards only work if new buyers keep showing up.
StonkBroker Technical Analysis and Chart Breakdown
On the daily chart against USDT, StonkBroker opened near $0.0178, reached a high of $0.0195, dipped to $0.0169, and trades were last changing hands around $0.0181, per TradingView data.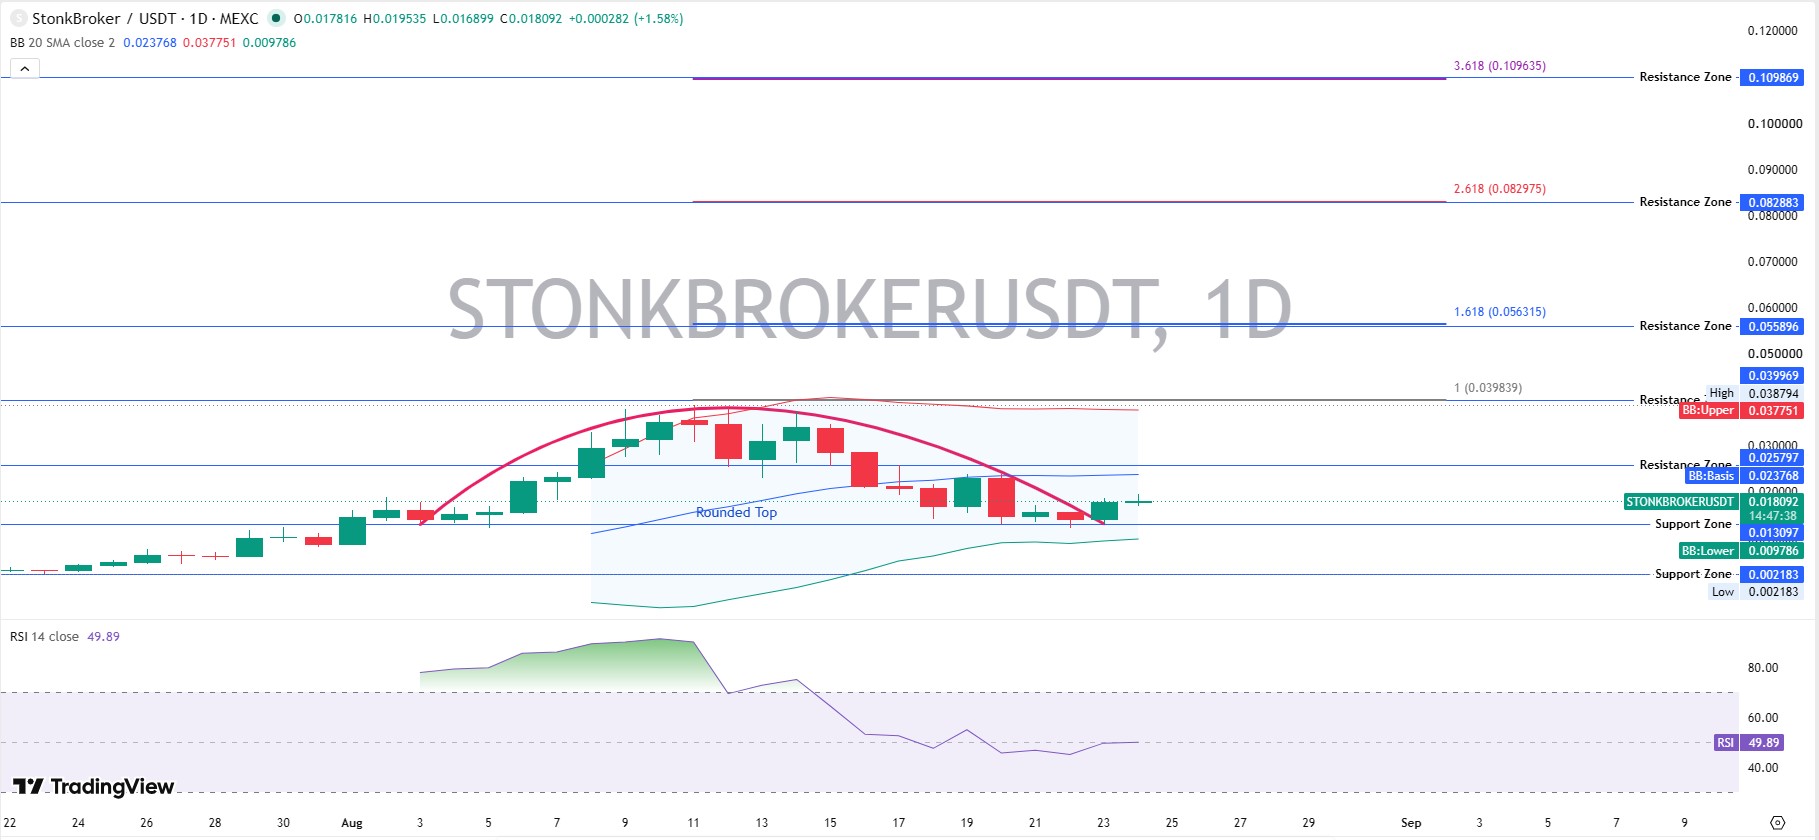
The RSI reads 49.89, sitting right in the neutral zone. Momentum is not strongly bullish or bearish right now.
The daily structure shows a rounded top. The price climbed steadily from late July, peaked near $0.039 around August 11, then rolled over slowly instead of crashing. That is a distribution pattern, not a breakdown.
Bollinger Bands show trades happening below the 20-day basis line at $0.0238, with the upper band at $0.0378 and the lower band at $0.0098.
Support and Resistance Levels
Near-term support sits at $0.0131, with a deeper floor at $0.0098. Below that, the July low near $0.0022 is the last line of defense.
On the upside, resistance clusters at $0.0258 first, then the prior high zone near $0.039. Fibonacci extensions point toward $0.056 and beyond if momentum returns, though those levels need a fresh catalyst to matter. Traders tracking the full STONKBROKER price prediction outlook tend to treat those extensions as long-shot targets, not base-case expectations.
StonkBroker and the Robinhood Chain Memecoin Wave
StonkBroker is not pretending to be a utility token. It is a memecoin, built around stock-market satire, living on Robinhood Chain.
That shapes how it behaves. Memecoins move on attention, not fundamentals, and a burn plus a rewards drop is exactly the kind of catalyst this category responds to.
The numbers back that up. $STONKBROKER sits over 3,000% above its July low, yet more than 53% below its August high. That is memecoin volatility, plain.
Basically, trading this like a blue-chip asset is the wrong approach. Traders watching the wider Robinhood Chain memecoin space size positions accordingly.
On-Chain Numbers Worth Knowing
Data from the Robinhood Chain explorer shows 27,878 holders and over 2.3 million transfers for the $STONKBROKER contract.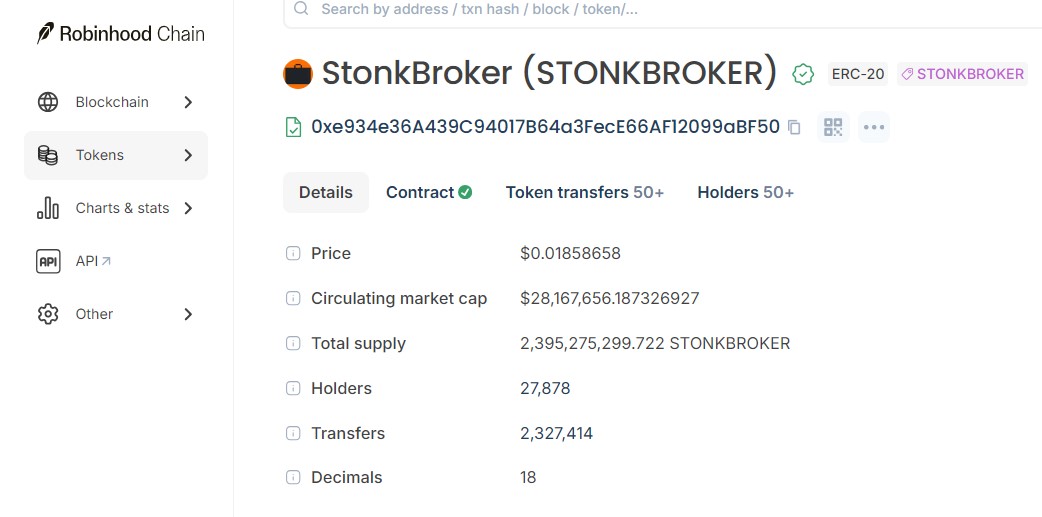
That holder count grew fast for a token roughly six weeks old, and circulating supply sits near 1.19 billion out of a 2.44 billion max supply.
We noticed something else digging through the futures data: volume is heavily concentrated on BingX, which handled over $732,000 in recent futures volume versus under $100,000 on MEXC. That concentration, tracked the same way airdrop campaigns get tracked, means liquidity could thin out fast if BingX activity drops.
StonkBroker Price Prediction: Bear, Base, and Bull Scenarios
Timeframe | Bear Case | Base Case | Bull Case | Probability | Invalidation |
7 Days | $0.012 | $0.018 to $0.020 | $0.026 | Bear 35% / Base 45% / Bull 20% | Trades break below $0.0131 with rising volume |
30 Days | $0.008 | $0.020 to $0.024 | $0.038 to $0.040 | Bear 40% / Base 40% / Bull 20% | Loss of the $0.0098 support band |
Early 2027 | $0.005 | $0.022 to $0.028 | $0.06 to $0.08 | Bear 45% / Base 35% / Bull 20% | Holder growth stalls or the burn program ends |
These are scenario ranges, not guarantees. STONKBROKER could move outside all three if a fresh catalyst or a broader downturn hits.
What Could Happen Next for $STONKBROKER
Short-term, the token likely consolidates between $0.013 and $0.026 while the market digests the burn news. If broader sentiment stays firm, and Fed meeting commentary does not spook risk assets, $STONKBROKER has room to retest $0.026 to $0.030.
But if Bitcoin price rolls over, small-cap memecoins on newer chains tend to fall first and hardest.
And progress on the Clarity Act legislation can shift risk appetite across the whole altcoin space, $STONKBROKER included.
Risks Traders Should Watch
Fully diluted value still dwarfs market cap, so future unlocks could add sell pressure even as burns continue. A new exchange listing can bring a burst of volume, but thin order books elsewhere can cause sharp wicks in both directions.
Regulatory shifts, like EU MiCA enforcement against unlicensed platforms or shifting White House crypto meeting odds, are reminders that exchange access is not guaranteed everywhere.
Real upside, real downside, nothing safe about it.
Final Take
Putting this StonkBroker price prediction together, the setup leans cautiously bullish while the burn and rewards story keeps pulling in holders and turns neutral to bearish fast if broader risk sentiment turns or BingX volume dries up.
For more coverage like this, check ongoing crypto news updates as the story develops.
Disclaimer: This article is for informational purposes only and is not financial advice. Cryptocurrency markets are highly volatile, and prices can move sharply in either direction. Do your own research and consult a licensed financial advisor before making investment decisions. CoinGabbar and the author hold no responsibility for losses resulting from trading decisions based on this content.












.webp)




