UP Price Prediction: Can It Reclaim the $1.25 Resistance Zone Now?


Every trader watching Robinhood Chain right now is asking the same thing this morning. A token barely two months old just did something most new listings never manage, and now the whole conversation has shifted from "will it pump" to "can it hold." That shift matters more than people realize.
Why Everyone Is Suddenly Talking About the UP Token
UP price prediction conversations picked up fast this week, and it is not hard to see why. The token pulled off a move that turned a lot of quiet watchers into loud ones. Robinhood Chain's native asset has been climbing since early August, and traders who missed the first leg are now stuck asking a harder question, one covered in recent UP breakout coverage earlier this week.
Do you chase it here or wait?
There is a reason this feels urgent. UP touched an all-time high just a day ago, then gave some of it back almost immediately. That kind of swing tends to separate the early holders from the late ones fast.
But is the pullback normal, or is it the first crack in the story? Keep that question in mind.
Where UP Price Stands Right Now
As of 04:30 UTC on September 1, 2026, UP is trading near $0.98, up 6.67% on the four-hour chart after tapping a session high of $1.0082. The token's all-time high sits at $1.26, hit on August 31, 2026, just hours before this snapshot. It's also up over 3,000% from its all-time low of $0.03036, set on August 1, 2026, according to live UP market data.
The circulating supply is roughly 19.9 million UP against a total supply of 503 million. Market cap sits near $18.9 million, while fully diluted valuation runs closer to $489 million. That gap between market cap and FDV is the first thing anyone doing UP price prediction work needs to sit with.
Why Is UP Price Moving Today?
This rally didn't come from nowhere. UP crossed $10 million in total value locked this week, a milestone the team flagged directly, alongside coverage of the Robinhood listed DEX token building momentum. It also picked up verification on fomo, a listing signal that tends to pull in fresh eyes.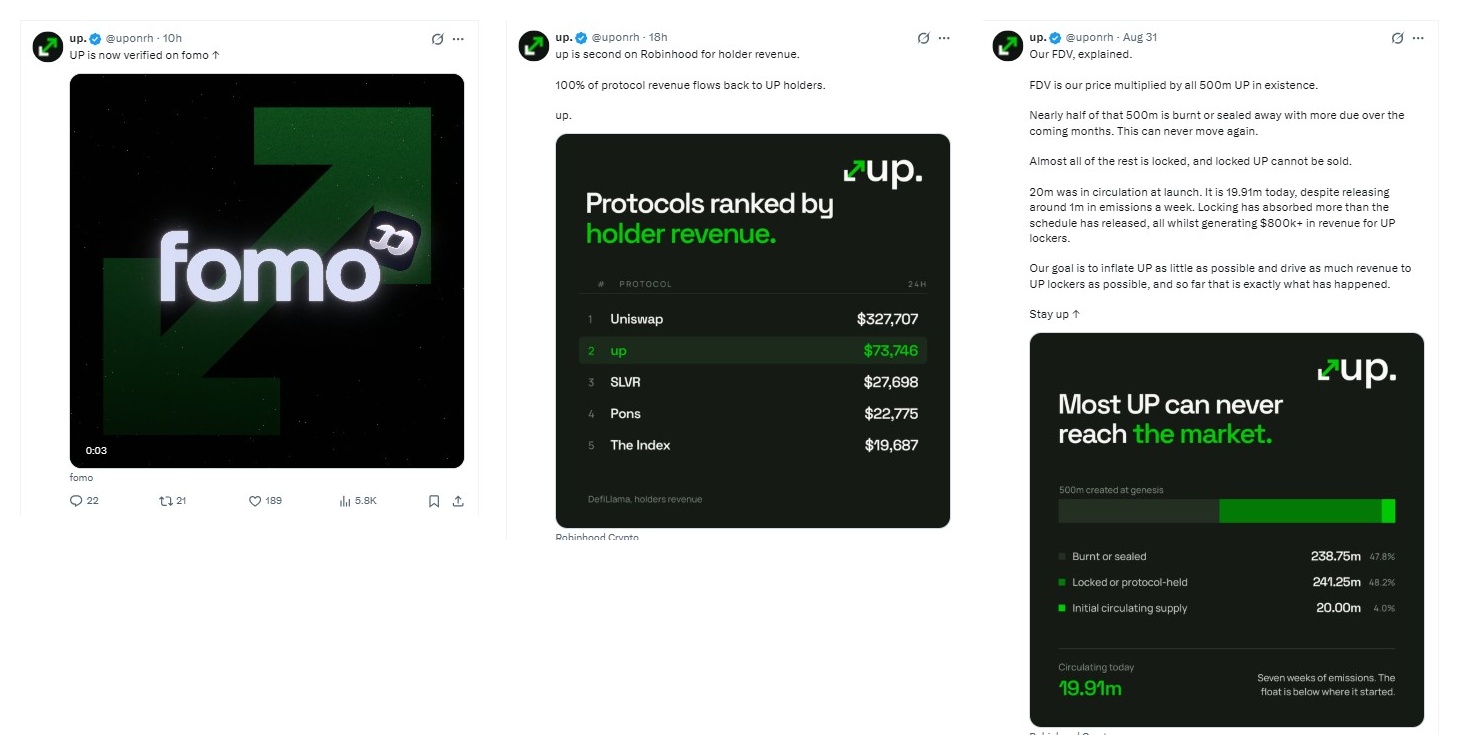
And there's a revenue angle too. UP now ranks second among all Robinhood ecosystem protocols for holder revenue, generating $73,746 in 24-hour fees, trailing only Uniswap, per the official revenue announcement.
Turns out, supply mechanics are doing heavy lifting here. Of the 500 million UP created at genesis, 47.8% is burnt or sealed forever, and another 48.2% sits locked as veUP, according to the team's own FDV explained thread. Only 4% ever reached the open market at launch. Less float, more pressure, in either direction.
UP Price Chart Analysis: Support and Resistance
The four-hour trading chart, and the first thing that stood out was the RSI reading. At 74.88, it's sitting in overbought territory. 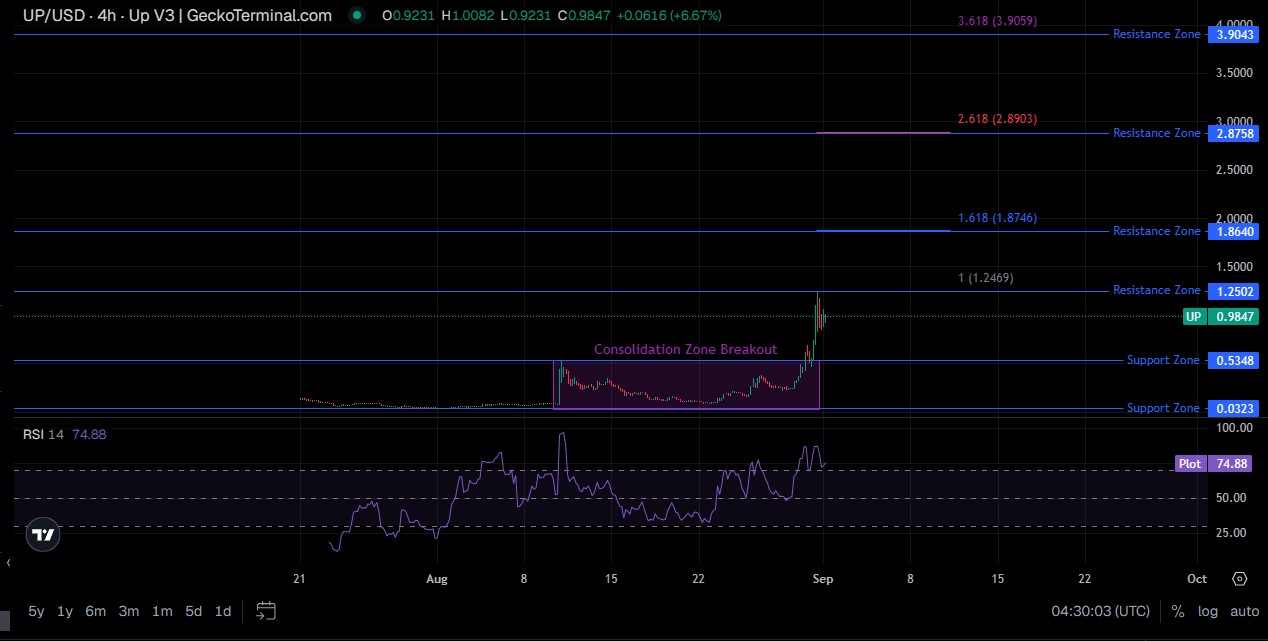
That doesn't mean a reversal is guaranteed, but it does mean momentum is stretched.
The price broke out of a long consolidation zone that had capped trading between $0.03 and $0.53 for most of August. That breakout is the whole story right now.
Immediate support sits near $0.5348, the top of the old consolidation range. Below that, $0.0323 marks the deeper floor. On the upside, resistance stacks up in Fibonacci extension zones at $1.2502, then $1.8640, then $2.8758.
Fibonacci extensions project where price could travel once it clears a prior range, using ratios like 1.618 and 2.618 drawn from the breakout's starting and ending points. They're not guarantees. But they mark where profit-taking and fresh selling tend to cluster.
Bulls are defending the breakout zone. But volume needs to confirm the next leg, not just follow it. Trades above $1.25 with rising volume would strengthen the bullish momentum case. A drop back under $0.53 would undo most of this month's structure. This kind of setup rewards patience over impulse, and that's rarely the popular answer.
Altcoin Fundamentals: The veUP Two-Token Model
UP runs a two-token system common among newer DeFi altcoins, a structure examined in broader tokenomics presale whitepaper breakdowns. Liquid UP trades freely and carries no governance weight. Lock it, and it becomes veUP, a position that holds voting power and collects 100% of protocol fee income, scaled by how long the lock runs, up to four years.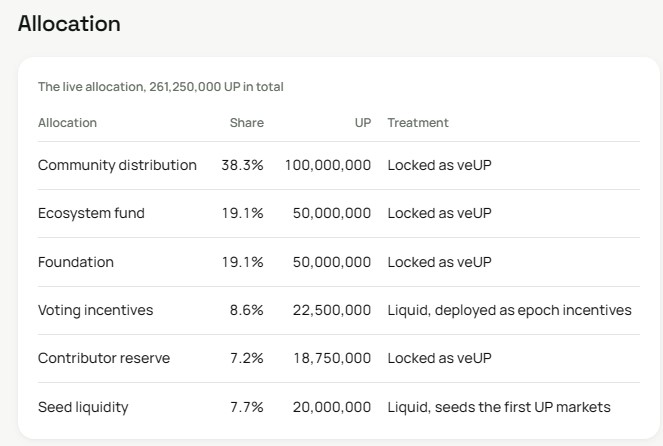
Of the 261.25 million UP in live allocation, 38.3% sits with the community, already locked as veUP. Foundation and ecosystem funds hold another 38.2% combined, also locked. Only the seed liquidity and voting-incentive buckets, under 16% together, stay liquid and sellable in the near term. Contract-level details are visible on the Robinhood Chain explorer.
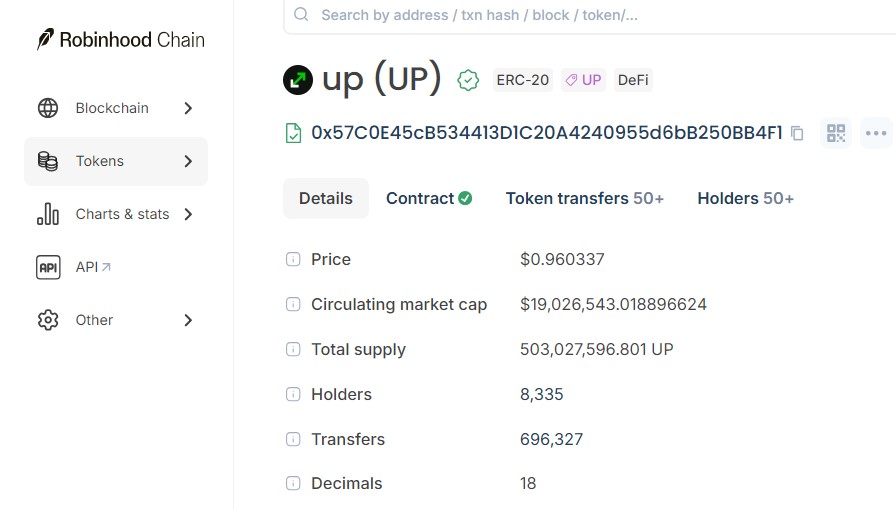
That structure explains a lot of the current UP price prediction debate. Selling pressure is mechanically limited while unlock schedules stay ahead of emissions, at least for now.
UP Price Prediction: Bear, Base, and Bull Scenarios
Timeframe | Bear Case | Base Case | Bull Case | Probability | Invalidation |
7 Days | $0.55 | $0.85 | $1.25 | Bear 30% / Base 45% / Bull 25% | Trading below $0.53 |
30 Days | $0.40 | $1.10 | $1.86 | Bear 25% / Base 40% / Bull 35% | Sustained close-outs under old range |
Early 2027 | $0.30 | $1.86 | $2.88 | Bear 20% / Base 35% / Bull 45% | veUP lock ratio dropping sharply |
For a wider view beyond this single token, more price prediction coverage tracks similar setups across the market.
What Could Invalidate This UP Price Prediction
Nothing here is locked in stone. If holders start unlocking veUP faster than new emissions get absorbed, the whole thesis about scarcity weakens fast. A break and hold under $0.5348 would flip near-term structure bearish.
Top-10 wallets currently hold 97.43% of supply. That's heavy concentration. One large wallet moving could shake price more than any chart pattern.
Broader risk-off conditions across crypto, tied to ongoing Clarity Act developments, could also drag altcoins lower regardless of individual fundamentals. Movements in bitcoin market trends tend to set the tone for smaller-cap tokens like this one too.
Conclusion
UP just proved it can move fast in both directions. The UP price prediction picture right now leans cautiously bullish, supported by locked supply and rising fee revenue, but stretched RSI and heavy wallet concentration keep real risk on the table. Traders tracking new exchange listings and the crypto events calendar will want to watch $0.53 on the downside and $1.25 on the upside. Everything else is noise until one of those breaks.
Disclaimer
This article is for informational purposes only and does not constitute financial, investment, or trading advice. Cryptocurrency markets, including altcoins like UP, are highly volatile and carry substantial risk. Always do your own research and consult a licensed financial advisor before making investment decisions.
Also read:
















